
Azure Virtual Desktop (AVD) is one of the fastest-growing workloads on Azure. It delivers Windows desktops and apps to remote workers at scale, without the complexity of managing physical desktop hardware. But for FinOps practitioners, finance teams, and IT managers, AVD has earned a reputation for one specific thing: unpredictable and difficult-to-attribute cloud costs.
Unlike a single VM with a predictable monthly line item, AVD cost is made up of a web of interconnected components (compute, storage, networking, licensing, and monitoring), each billed separately and each driven by user behaviour that shifts week to week. Understanding that full picture is the first step to controlling it.
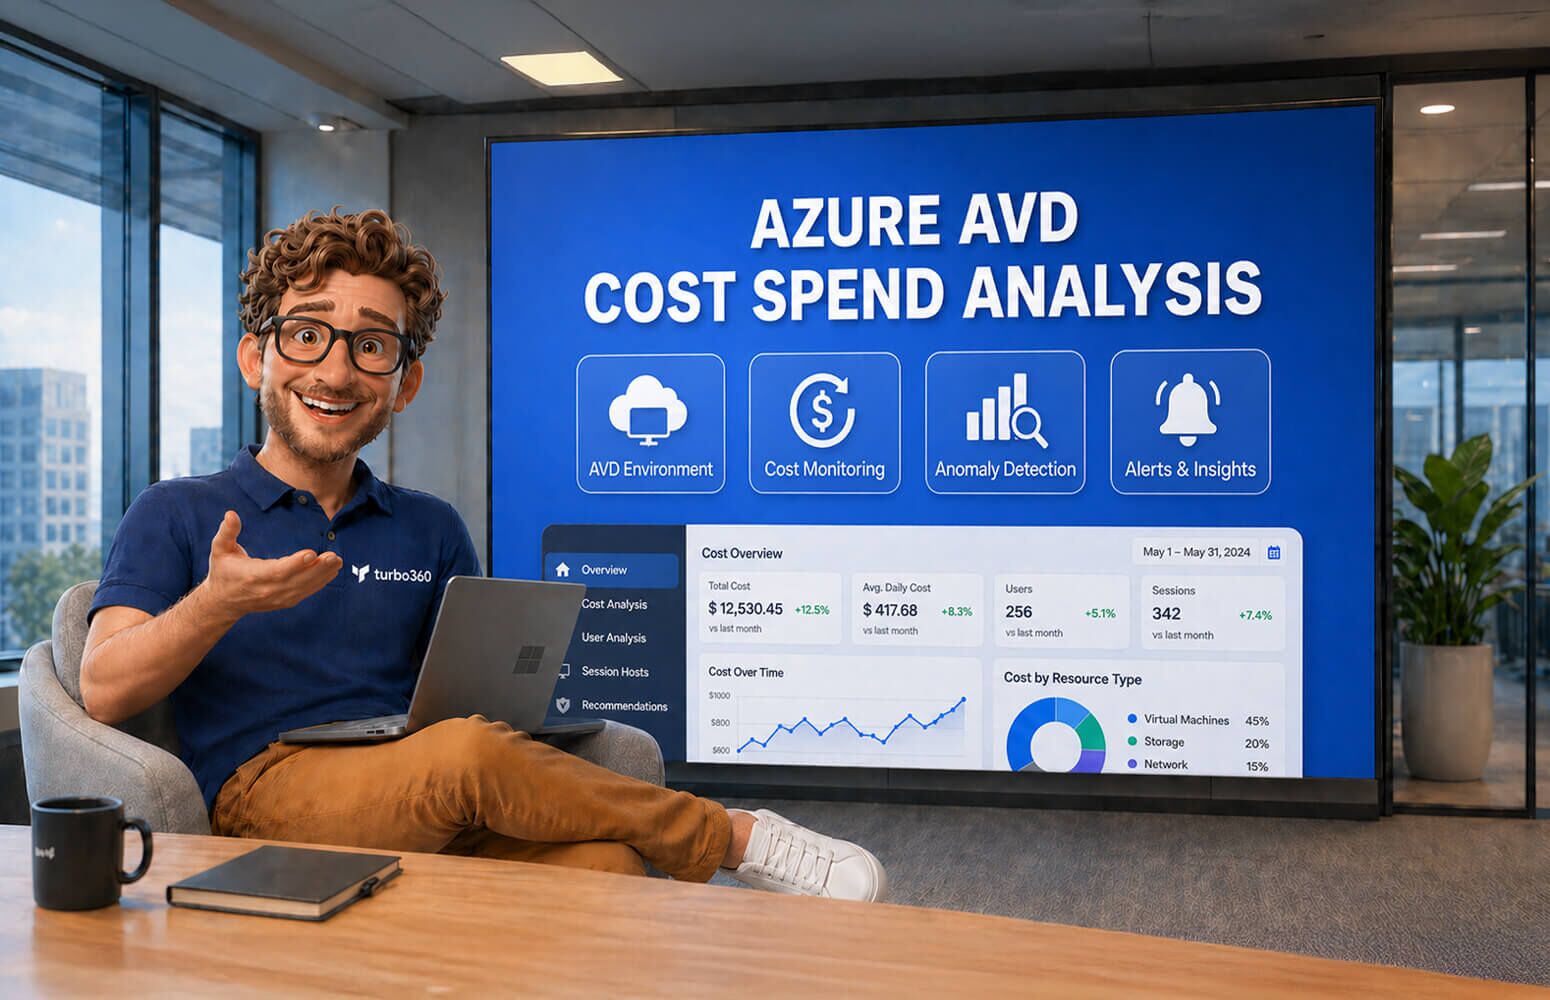
This guide walks through every cost driver in an AVD deployment, how to analyse your spend accurately, where organisations most commonly overspend, and how purpose-built tooling like Turbo360 Cost Analyzer closes the gaps that native Azure tooling leaves open.
70%
of AVD session host costs are avoidable through autoscaling and scheduling
40%
average saving when Hybrid Benefit is applied to eligible Windows session hosts
3x
more AVD cost components compared to a typical IaaS workload
15-30%
of total AVD spend typically recoverable with structured FinOps practices
What is Azure Virtual Desktop and why does it generate complex costs?
Azure Virtual Desktop is a Microsoft-managed desktop and app virtualisation service running on Azure infrastructure. It allows organisations to deliver a full Windows 10 or Windows 11 experience to any device (including thin clients, personal laptops, and mobile) via Azure-hosted virtual machines.
The service itself carries no licensing fee from Microsoft. There is no charge for using the AVD management plane. However, the underlying Azure resources it consumes, and the Windows licensing required, generate costs across at least six distinct categories simultaneously.
This multi-dimensional billing model is the root cause of AVD cost complexity. Most other workloads map neatly to one or two resource types. AVD does not. A single user session can touch compute, managed disks, file storage, bandwidth, private DNS, monitoring, and backup, each billed separately with different meters and different usage patterns.
Key insight: AVD costs scale with active user sessions, not just deployment size. A 1,000-seat AVD environment used by 200 concurrent users during peak hours behaves very differently from one where 800 users are online simultaneously. Cost modelling must account for concurrency, not just headcount.
The six cost components of Azure Virtual Desktop
Before you can analyse AVD spend, you need a clear taxonomy. Here are the six principal cost drivers in every AVD deployment.
1. Session host virtual Machines
Session host VMs are the dominant cost item in virtually every AVD deployment, typically accounting for 60-75% of total AVD spend. These are the VMs that users actually connect to and run their Windows sessions on.
Session hosts come in two pool types, each with different cost implications:
| Host Pool Type | How it works | Cost profile | Best for |
| Pooled (multi-session) | Multiple users share one VM (Windows 10/11 multi-session) | Lower per-user cost, cost scales with concurrent sessions | Task workers, call centres, knowledge workers with light workloads |
| Personal (single-session) | Each user gets a dedicated VM | Higher cost, easier to attribute, no multi-tenancy | Power users, developers, creative professionals, regulated roles |
The VM SKU you choose has an outsized impact on cost. D-series (general purpose) and E-series (memory-optimised) are most common. The difference between a Standard_D2s_v5 and Standard_D4s_v5 session host doubles your compute bill, and many environments are over-provisioned by one full size tier.
2. Storage Costs
Storage in AVD is generated by three sources that are often missed in initial cost estimates:
- OS managed disks: Each session host has an OS disk (typically 128 GB). Premium SSD (P10) is common but often unnecessary; Standard SSD delivers adequate performance for most workloads at materially lower cost.
- FSLogix profile containers: AVD uses FSLogix to redirect user profiles to Azure Files shares or Azure NetApp Files. Profile storage grows with user count and data retention policies. Azure Files Premium incurs higher per-GB costs; Standard is sufficient for most task worker profiles.
- Custom image storage: The golden images used to provision new session hosts are stored as managed disk snapshots or images in Azure Compute Gallery. Stale, unmanaged image versions accumulate cost silently.
Common waste: Orphaned OS disks from deprovisioned session hosts remain attached and billed even when the VM is deleted, unless explicitly cleaned up. In large pooled deployments with frequent autoscaling, this is a significant source of undetected ongoing cost.
3. Networking Costs
AVD generates two categories of network cost: internal Azure traffic and internet egress from user sessions.
- Outbound data transfer: Each user session generates egress traffic from Azure as the display protocol (RDP/UDP) streams screen updates to the endpoint device. Bandwidth-intensive use cases (video streaming, large file downloads) amplify this significantly.
- VNet peering and hub-spoke traffic: If session hosts sit in a spoke VNet that peers to a hub for shared services (DNS, internet breakout, on-premises connectivity via ExpressRoute), every packet crossing the peering link incurs a charge. With large user populations this can become a meaningful line item.
- Private endpoints: Azure Files shares with private endpoints for FSLogix profiles are billed per-endpoint per-hour, plus per-GB processed. Unused private endpoints continue billing indefinitely.
4. Licensing Costs
AVD licensing is included with several Microsoft 365 and Windows Enterprise subscription tiers, but only if the right licence is active. The key licences that entitle users to AVD are:
- Microsoft 365 E3 / E5 / F3
- Windows 10/11 Enterprise E3 / E5
- Microsoft 365 Business Premium
- Windows 10 Enterprise VDA (for devices that do not qualify for per-device licensing)
If your users lack an eligible licence, you will be billed separately for Windows client access rights on top of VM compute. Additionally, any per-user applications (Microsoft 365 Apps, Intune, Defender for Endpoint) add to the per-seat cost basis and should be included in total-cost-of-ownership (TCO) calculations.
Azure Hybrid Benefit is a critical lever here: if you hold qualifying Windows Server or Windows 10/11 Enterprise licences with Software Assurance, you can apply Hybrid Benefit to session host VMs and eliminate the Windows component of VM compute costs, a saving of up to 40% on the VM compute line.
5. Monitoring and Diagnostics
AVD diagnostics (session events, connection reliability metrics, host health) are routed through Azure Monitor, Log Analytics, and optionally Application Insights. The costs here are workload-driven and frequently underestimated:
- Log Analytics ingestion: Billed per GB ingested. High-volume AVD environments generate substantial diagnostic telemetry; every connect, disconnect, error, and feed event is logged.
- Log Analytics retention: Default 30-day retention is free; beyond 30 days incurs retention charges per-GB per month.
- Azure Monitor Metrics: Basic platform metrics are free; custom metrics and workbook queries beyond the free tier are billed by query volume.
6. Supporting Infrastructure
A complete AVD deployment often requires infrastructure that does not carry an AVD tag but is functionally part of the service:
| Component | Why it exists | Cost consideration |
| Azure Active Directory / Entra ID | User identity and session brokering | P1/P2 licences if MFA or Conditional Access is required |
| Domain Controllers or Azure AD DS | Hybrid AD join for session hosts | Azure AD DS billed per-hour by SKU; DC VMs billed as standard compute |
| Azure Backup | Profile container and VM backup | Per-instance and per-GB billing; often applied broadly when selective scope is cheaper |
| Azure Bastion / Jump Hosts | Administrative access to session hosts | Azure Bastion billed per-hour per SKU; always-on even when unused |
| Azure Image Builder | Automated golden image builds | Ephemeral build VMs billed at standard compute rates during image build runs |
How to analyse Azure AVD spend natively
Microsoft Cost Management (built into the Azure portal) is the starting point for AVD cost analysis. It provides the raw data, but interpreting it for AVD requires deliberate configuration.
Tagging AVD resources consistently
The single most important prerequisite for accurate AVD cost analysis is a consistent tagging strategy. Without tags, Azure Cost Management cannot separate AVD workload costs from general subscription spending. Recommended mandatory tags for AVD resources:
- Workload: AVD, applied to all session hosts, disks, file shares, and supporting VMs
- HostPool: The specific pool name (e.g. pooled-standard, personal-developers)
- Department or CostCentre: For chargeback or showback to business units
- Environment: prod / dev / test
- Region: Where session hosts are deployed (relevant for multi-region AVD)
Azure Policy with the modify effect can enforce tag inheritance so that resource groups pass tags down to new resources automatically, which is critical in pooled deployments where session hosts are provisioned and deprovisioned frequently by autoscaling.
Cost analysis views in the Azure portal
With tags in place, the Azure Cost Management Cost Analysis blade can be scoped and filtered to show AVD-specific spend. The most useful views:
| View | How to configure it | What it reveals |
| Cost by service name | Group by Service Name, filter by Workload tag = AVD | Breakdown of compute vs storage vs networking vs monitoring spend |
| Cost by resource | Group by Resource, filter by Resource Group containing AVD hosts | Individual VM costs, identifies top spenders in the pool |
| Cost by host pool | Group by HostPool tag | Per-pool spend, essential for comparing pooled vs personal pool efficiency |
| Cost by department / cost centre | Group by Department or CostCentre tag | Showback report for business units consuming AVD resources |
| Daily cost trend | Accumulated cost, daily granularity, current month | Identifies spend spikes caused by scale-out events or orphan resource creation |
Setting AVD budgets and alerts
Azure Cost Management Budgets allow you to set monthly spend thresholds with automated alerts. For AVD, the recommended approach is to set budgets at two levels:
- Resource-group-level budget per host pool, so you are alerted when a specific pool exceeds its expected cost envelope
- Tag-based budget on the Workload = AVD tag, for a total AVD programme budget that aggregates across all pools and regions
Budget alerts can trigger email notifications, webhook calls to Teams or Slack, or Azure Logic Apps actions, enabling automated responses when spend anomalies occur.
Top AVD cost optimisation opportunities
Once you have visibility into your AVD spend, the next step is identifying where the savings opportunities are. These five optimisations consistently deliver the largest returns.
1. Autoscaling: Stop paying for idle session hosts
AVD Autoscale (generally available since 2023) allows pooled host pools to scale session host capacity up and down based on active session counts and a configurable schedule. The business case is straightforward: session hosts running with zero or near-zero users are pure waste.
A typical enterprise AVD environment sees 80%+ of active usage concentrated in a 9-10 hour working window. By scaling down to a minimum number of standby hosts overnight and at weekends, and scaling out dynamically as users arrive in the morning, organisations routinely achieve 40-60% reduction in session host compute costs compared to a static, always-on deployment.
Key autoscale parameters to get right:
- Ramp-up schedule: Start scaling up 30-45 minutes before peak hours to avoid session queuing
- Minimum hosts during off-peak: Keep at least one host running in each host pool for connection testing and monitoring
- Scale-in threshold: The session load percentage below which hosts are drained and deallocated; tune based on actual session duration patterns
2. Azure reserved instances for baseline hosts
Not all session hosts scale down. Minimum always-on hosts, which are baseline capacity that runs 24/7, are prime candidates for Reserved Instances. A 1-year reservation on Standard_D4s_v5 session hosts delivers approximately 40% savings vs pay-as-you-go; a 3-year reservation can reach 60-65%.
The correct approach is a hybrid commitment strategy: reserve a floor of always-on capacity, then let the dynamic portion above the floor run on pay-as-you-go or Spot VMs (for non-critical test workloads). Avoid reserving more than your confirmed baseline; unused reservations waste the commitment.
3. Azure hybrid benefit on session hosts
If your organisation holds Windows 10/11 Enterprise or Windows Server licences with Software Assurance (common in EA and MCA customers), enabling Azure Hybrid Benefit on session host VMs removes the Windows licence component from the VM compute bill, a saving of approximately 40% on the Windows VM cost that requires nothing more than a checkbox in the Azure portal or an ARM/Bicep parameter change.
Stacking savings: Azure Hybrid Benefit + Reserved Instances can be combined on the same VM. An organisation with a 3-year reservation and Hybrid Benefit on baseline session hosts can achieve 75-80% savings versus pay-as-you-go non-Hybrid pricing.
4. Right-size session host VMs
Over-provisioning is endemic in AVD deployments. IT teams provision larger VM SKUs to avoid performance complaints, a rational instinct that results in predictable overspend. Azure Advisor provides rightsizing recommendations based on 7-day CPU and memory utilisation data, but AVD workloads require additional context: peak concurrent session load, application CPU profiles, and the impact of a resize on session user experience.
The recommended approach: use AVD Insights (built on Azure Monitor Workbooks) to establish per-host CPU, memory, disk I/O, and network utilisation at peak session load, then validate whether a smaller VM SKU sustains acceptable performance at that concurrency level before resizing production hosts.
5. Profile storage tier optimisation
FSLogix profile containers stored on Azure Files Premium are a common area of overspend. Premium Azure Files (SSD-backed) is priced at approximately 3-4× the cost of Standard Azure Files (HDD-backed). For typical task worker profiles (Office documents, browser caches, light application data), Standard tier delivers adequate throughput and latency at significantly lower cost.
Migration from Premium to Standard Azure Files is a day-1 configuration choice that is difficult to change retroactively, but for new deployments or environment refreshes it should be evaluated based on actual measured IOPS requirements, not conservative assumptions.
Challenges with native AVD cost analysis
Microsoft Cost Management is a capable tool for raw spend visibility, but practitioners who manage AVD at scale consistently hit the same limitations:
| Challenge | Why it happens | Business impact |
| No cross-subscription AVD view | AVD deployments often span multiple subscriptions; Cost Management management-group views have limited analysis capability | Finance teams can’t see total AVD programme cost without manual aggregation |
| Delayed cost data | Azure usage data has a 24-48 hour lag before appearing in Cost Management | Anomalies (unexpected scale-out, runaway VM deployment) are not visible until the next business day |
| Tagging inconsistency at scale | Autoscale provisions new session hosts without carrying all required tags unless Azure Policy is explicitly configured | Cost allocation views are incomplete; chargeback reports are inaccurate |
| No per-user cost attribution | Azure does not meter cost at the session or user level, only at the resource level | Organisations cannot show individual business units their actual consumption in a shared pooled deployment |
| Manual reporting effort | Generating a monthly AVD cost report for finance requires exporting CSVs, joining data in Excel or Power BI, and manual interpretation | FinOps practitioners spend hours each month on reporting instead of analysis and action |
| No automated savings actions | Cost Management surfaces recommendations but cannot act on them; rightsizing, tagging fixes, and reservation purchases require manual steps | Savings opportunities identified but not actioned; the gap between recommendation and realisation is weeks or months |
How Turbo360 cost analyzer transforms AVD cost management
Turbo360 Cost Analyzer is purpose-built for Azure FinOps teams who need to go beyond what Microsoft Cost Management provides. For AVD environments specifically, it closes five critical gaps that native tooling leaves open, turning AVD spend from a black box into a fully managed, allocated, and continuously optimised line item.
1. Unified AVD cost view across subscriptions and host pools
Turbo360 aggregates AVD cost data across all subscriptions, resource groups, and host pools into a single dashboard. Whether your pooled desktops are in one subscription and personal desktops for developers are in another, Turbo360 presents a unified AVD programme view, no manual aggregation, no CSV exports.
Costs can be sliced by host pool, VM SKU, region, department, cost centre, or any custom dimension, giving FinOps practitioners and finance teams the exact view they need without building it from scratch in Power BI.
2. AI-powered anomaly detection for AVD spend
One of the highest-risk patterns in AVD cost management is an unexpected autoscale event (a spike in concurrent sessions driven by a scheduled task, a runaway batch job, or a misconfigured scale plan) that creates hundreds of additional session host hours before anyone notices. Turbo360’s anomaly detection engine monitors AVD cost patterns in near real time and fires intelligent alerts when spend deviates from expected baselines.
Unlike Azure budget alerts (which fire when a total monthly threshold is crossed), Turbo360 alerts are contextual: they detect the specific resource, host pool, or cost dimension causing the anomaly, and route the alert to the right team with actionable context, not just a cost number.
3. Automated showback and chargeback for AVD
In shared pooled AVD deployments, attributing cost to individual business units is a challenge that native Azure tooling cannot solve without perfect tag coverage at the session level. Turbo360 Cost Analyzer supports configurable cost allocation rules that distribute shared AVD resource costs across departments or cost centres using proportional, fixed-percentage, or custom formulas.
The result: finance teams receive automated monthly showback reports per department (or full chargeback allocations if the organisation has reached that FinOps maturity level) without any manual work from the FinOps practitioner.
4. Savings opportunity identification and action
Turbo360 goes beyond surfacing recommendations. The platform identifies specific AVD optimisation opportunities (underutilised session hosts, VMs missing Hybrid Benefit, orphaned OS disks from deprovisioned hosts, oversized FSLogix file share allocations) and surfaces them with projected annual savings quantified in pounds or dollars.
For reserved instance and savings plan opportunities, Turbo360 analyses historical AVD compute consumption patterns to recommend the right commitment size and term, a critical capability given the blended compute patterns in environments that mix autoscale with always-on hosts.
5. Automated reporting without manual effort
Turbo360 delivers scheduled cost reports (daily summaries, weekly host pool breakdowns, monthly executive AVD FinOps reviews), automatically formatted and ready to share. For MSPs and CSPs managing AVD environments on behalf of multiple tenants, Turbo360 supports multi-tenant views and white-label reporting, enabling per-client AVD cost reports without building separate dashboards for each customer.
Unified Multi-Subscription View
All AVD host pools, across all subscriptions, in one dashboard.
AI Anomaly Detection
Near real-time alerts on unexpected AVD cost spikes with root-cause context.
Automated Showback
Department-level AVD cost reports delivered automatically, every month.
Savings Recommendations
Rightsizing, Hybrid Benefit gaps, RI opportunities, quantified in actual currency.
Multi-Tenant MSP Support
Per-client AVD cost views and white-label reporting for service providers.
Cost Allocation Rules
Distribute shared pooled AVD costs across business units with configurable formulas.
Explore Turbo360 Cost Analyzer Start Free Trial
Building an AVD FinOps practice: A phased approach
Mature AVD cost management does not happen overnight. The FinOps Foundation’s Crawl/Walk/Run maturity model maps directly to how organisations should approach it.
Crawl: Establish Visibility
- Implement mandatory tagging via Azure Policy across all AVD resource groups
- Create a Cost Management view filtered to AVD workload tags
- Set budget alerts at the host-pool level
- Verify Hybrid Benefit is applied to all eligible session host VMs
- Identify any orphaned disks or unattached private endpoints
Walk: Optimise and Allocate
- Enable AVD Autoscale on all pooled host pools with validated scale parameters
- Right-size session host VMs based on AVD Insights utilisation data
- Purchase Reserved Instances for baseline always-on capacity
- Configure automated showback reports per department
- Evaluate Azure Files tier against measured FSLogix IOPS requirements
- Clean up stale custom images from Azure Compute Gallery
Run: Govern and Continuously improve
- Implement full chargeback for AVD consumption to business unit cost centres
- Automate anomaly detection and alert routing to responsible teams
- Establish a monthly AVD FinOps review cadence with finance and IT leadership
- Track unit economics: AVD cost per seat, cost per active session hour
- Model AVD cost against on-premises VDI TCO for ongoing justification
AVD cost analysis: Key metrics to track
Effective AVD FinOps requires a small set of leading and lagging metrics tracked consistently. These are the KPIs that mature AVD FinOps programmes monitor monthly:
| Metric | How to calculate | Target direction |
|---|---|---|
| Cost per active user per month | Total AVD monthly cost ÷ average monthly active users | Decreasing, driven by efficiency improvements and autoscaling |
| Session host utilisation % | Average active session hours ÷ total provisioned session host hours | Increasing; idle session host time is wasted spend |
| Reserved Instance coverage % | Session host hours covered by reservations ÷ total session host hours | Target 60-80% of baseline capacity covered by RIs |
| Hybrid Benefit coverage % | Session hosts with Hybrid Benefit enabled ÷ total eligible session hosts | Target 100% for all eligible Windows VMs |
| Untagged resource % | AVD resources without required tags ÷ total AVD resources | Decreasing, drives allocation accuracy |
| Savings realised vs identified | Actions taken on savings recommendations ÷ total savings identified | Increasing, measures FinOps execution effectiveness |
Take Control of Your Azure AVD Spend
AVD costs are complex by design, but with the right visibility, allocation, and optimisation tooling in place, they are entirely manageable. Whether you are just getting started with AVD cost visibility or looking to move from showback to full chargeback, the path forward starts with understanding what you are actually spending and where.


