What is Distributed Tracing?
Distributed tracing is the functionality to trace requests or messages flowing through different systems or environments like frontend, Backend, middleware. Distributed tracing brings connectivity or visibility of various services using a unique identifier. This identifier is passed to different services to correlate them as a single flow.
We track data from different services with distributed tracing, but how do we visualize them? Visualization is a tedious task. To achieve this is where the distributed tracing tools come into play. Distributed tracing tools give you a central overview of how user requests perform in different services.
With these distributed tracing tools, you need not spend time traveling across services to identify where and why the failure has happened. You have access to these details in a single window.
Why do we need a distributed tracing tool?
- Having access to all necessary data from a single place – When we build applications in the cloud, it is not just a single service that does the whole job. We need to integrate multiple services to complete a business application. Since different services are spread across other platforms, users don’t get holistic visibility of the application. Lack of visibility results in reduced performance and efficiency of users as they spend a lot of time investigating how the application is built and where the failure has happened.
- Reduces overall complexity – Since we have all the service’s performance in hand, we can quickly identify where a failure has happened in a business process.
- Provides time for innovation – After reducing the overall complexity, teams are left with time to spend on innovation activities.
Distributed tracing tools help teams understand how each microservice is performing more quickly. This understanding helps them resolve issues rapidly, increase customer satisfaction, ensure steady revenue, and preserve time for teams to innovate.
Top 6 Distributed Tracing Tools
Here’s the list of the top distributed tracing tools we will be looking at in this article:
1. App Insights for distributed tracing
App Insights is an in-house solution offered by Microsoft Azure that provides extensible application performance management (APM) and monitoring for live web apps. It’s a cross-platform solution supporting .Net, Node.js, Java, and Python.
Users can leverage the SDKs available for custom solutions and enable Application Insights by using the Application Insights agent.
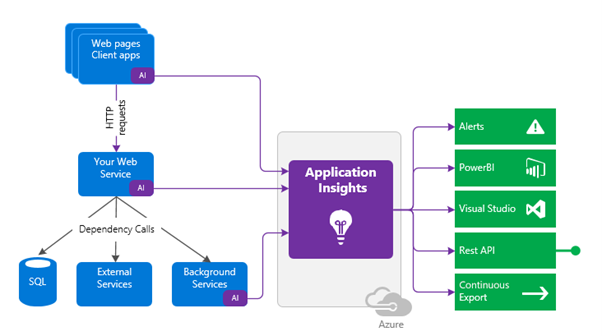
Application insight can monitor your application’s health and performance in real-time. You can visualize the application insights data from the Azure portal using the Application Map in Azure. Apart from this, app insights also offer a lot of additional capabilities like querying, etc.
2. Turbo360
Turbo360 is an enterprise product that provides simple yet powerful toolsets for all operational needs in Azure Cloud. Turbo360 offers an End-to-End distributed tracing feature called BAM.
BAM is a Azure Distributed Tracing Tool which helps users to identify how a transaction flows in a business process and spotlight failures in those transactions.
Turbo360 BAM can be instrumented in your business process containing services like Logic Apps, Function Apps, APIMs, On-prem system (capable of making an API call), etc. The approach is old school which helps us understand the working principle much faster and allows us to complete the setup process more quickly.
You need to do two steps to track data and visualize it in BAM.
- Designing your transaction in Turbo360 – First, you will be creating your business process flow in Serverlesss360 and choosing the platform in which a particular stage is executing.
- Instrumenting your business process – This process is responsible for data tracking across distributed services. Using the exposed APIs from Turbo360 or SDK and .Net libraries, you can instrument your business process. The approach here is, after instrumentation, BAM makes an API call from your business process to transfer all the captured or traced data to the UI.
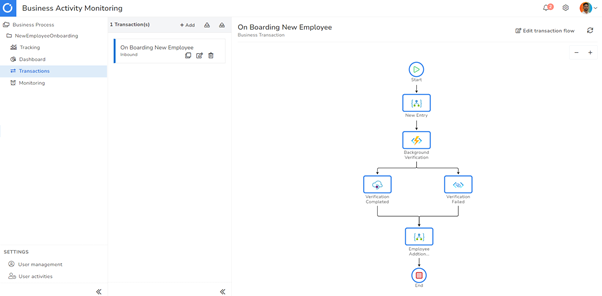
After these two steps, all the transactions your business process can be visualized in BAM.
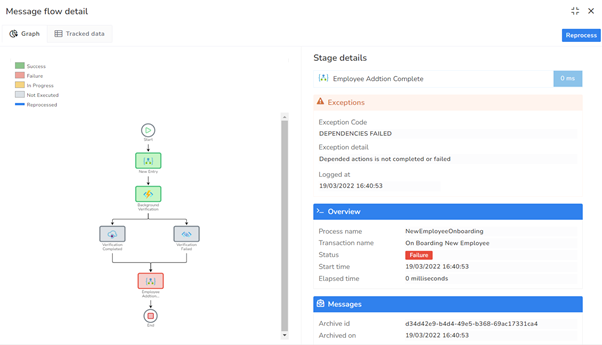
Once tracking is done, you can monitor the records or transactions to keep your business users informed on the business insights.
Turbo360 BAM is not like any other distributed tracing tool. It gives you a pictorial representation of your entire business process, which will benefit the support or operational team identifies an issue much quicker.
Some of the key features provided by the Turbo360’s BAM distributed tracing tool includes:
- Visual representation of the business process
- Reprocess a transaction from the Turbo360 BAM portal
- Monitor on the duration of business process to meet SLA
- Security – Inbuilt user management and governance reports
Since Turbo360 is a tool built specifically for Azure, we can also achieve End to End tracking without even instrumenting your code by leveraging the Application insights from Azure.
If you have enabled application insights in Azure, you can directly query and monitor the app insights data from Turbo360. Turbo360 offers you a library of some of the common queries you might use, and you can create your queries and save them for use later.
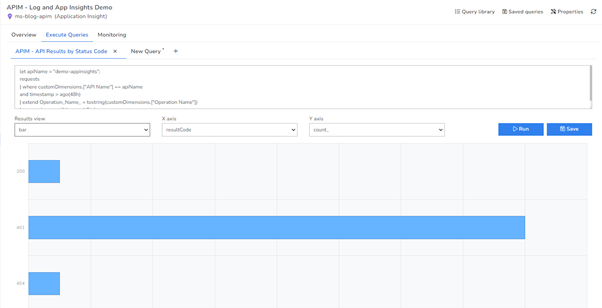
Only Turbo360 offers you end-to-end tracing with zero instrumentation by leveraging application insights in this list of distributed tracing tools. This tool gives a lot of opportunities to help application support operators get those deeper insights into application performance and troubleshooting to help solve issues quicker and lower the cost of supporting your Azure solutions.
Unveil the true potential of your Azure environment with Turbo360. Get hands on experience with the 15 day free trial.
3. SigNoz
SigNoz is a full-stack open-source APM tool that provides distributed tracing for cloud-native applications. It provides a unified UI for metrics and traces so that there is no need to switch between different tools like Jaeger and Prometheus.
Using SigNoz, you can quickly identify performance bottlenecks by going to the exact traces causing the problem and seeing detailed flamegraphs of individual request traces.
Some of the key features of SigNoz include:
- Seamless correlation of your application metrics with traces
- Running aggregates on your tracing data to get business-relevant metrics. For e.g., you can run aggregates to see latency experienced by customers who have customer_type set as premium.
- Detailed visualization of traces using Flamegraphs and Gantt charts
- Exceptions monitoring
- Setting up alerts on critical metrics to get notified when anything goes wrong
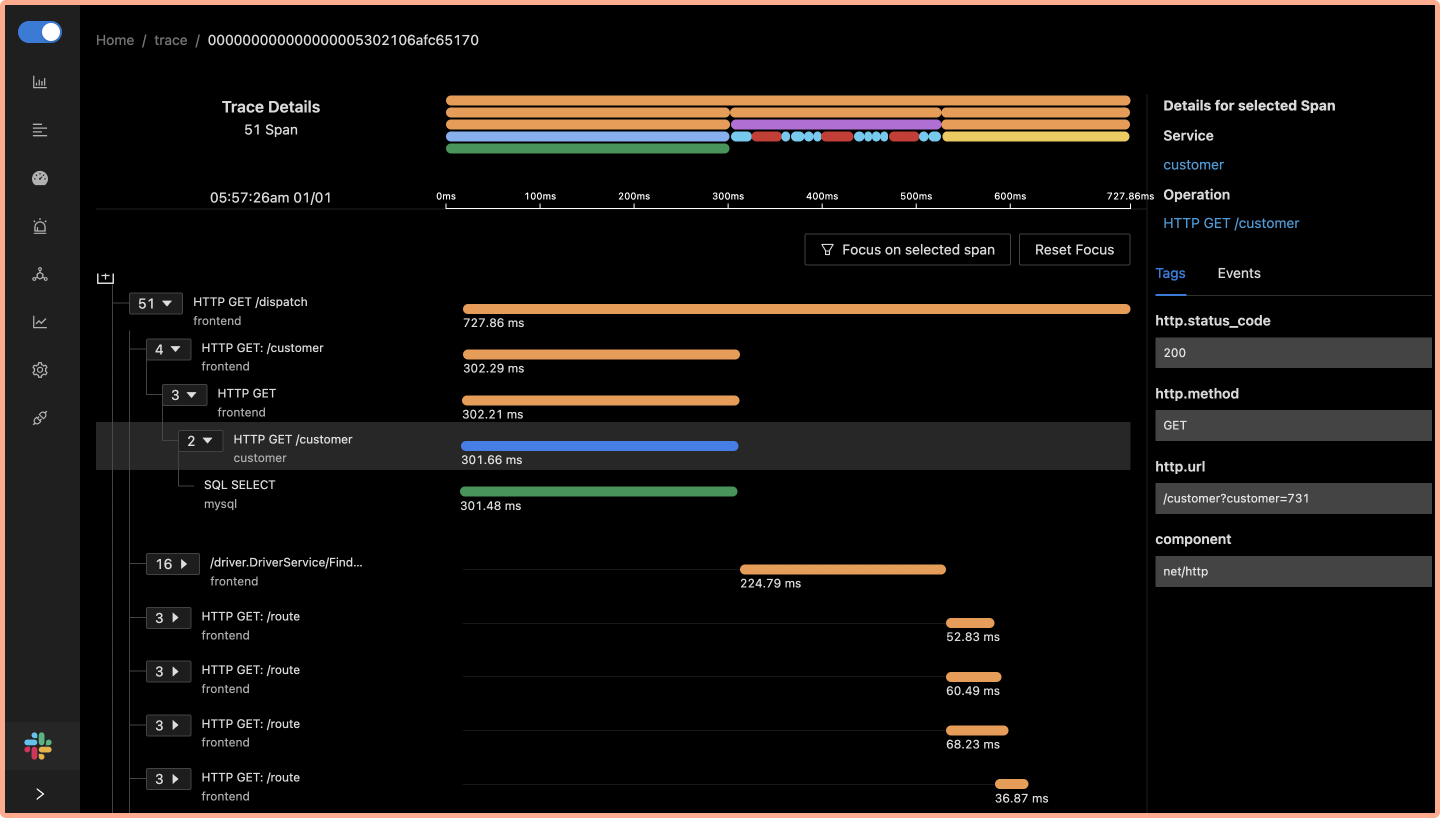
See a complete breakdown of user requests on SigNoz dashboard using Flamegraphs and Gantt Charts
You can analyze tracing data using filters based on tags, status codes, service names, operation, etc.
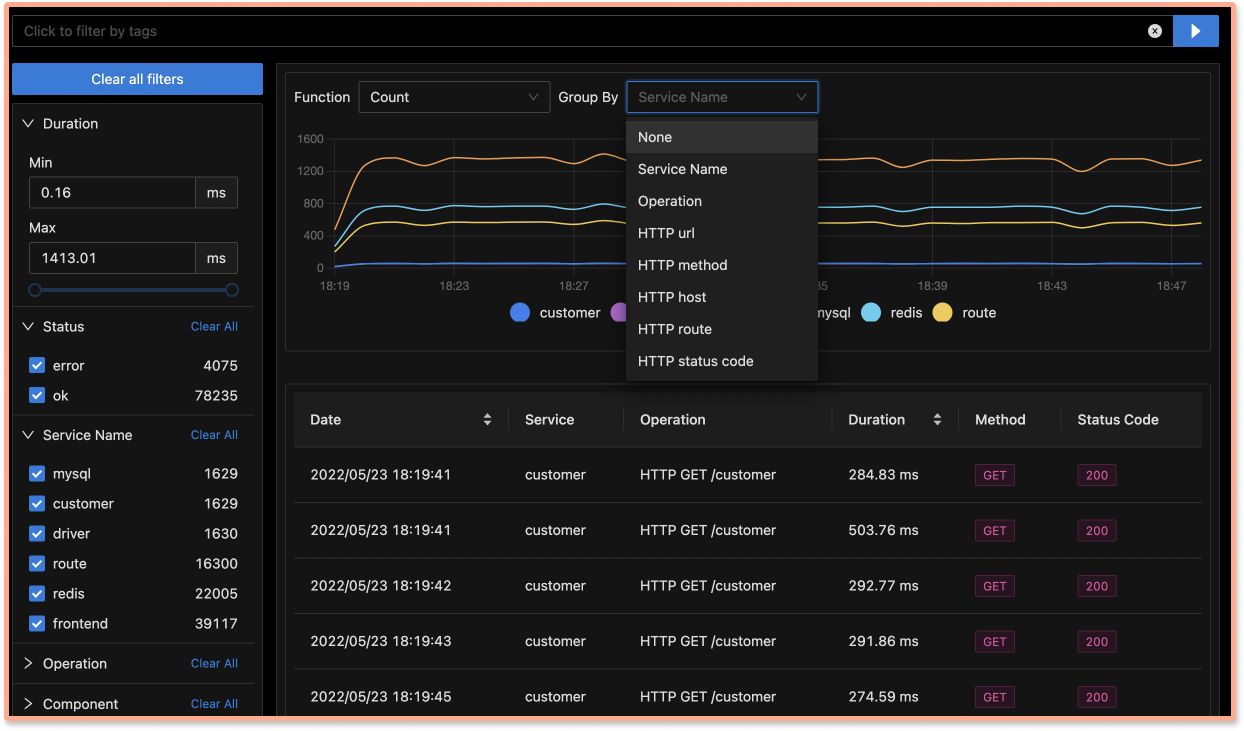
You can use advanced filters to analyze your tracing data
4. App Dynamics
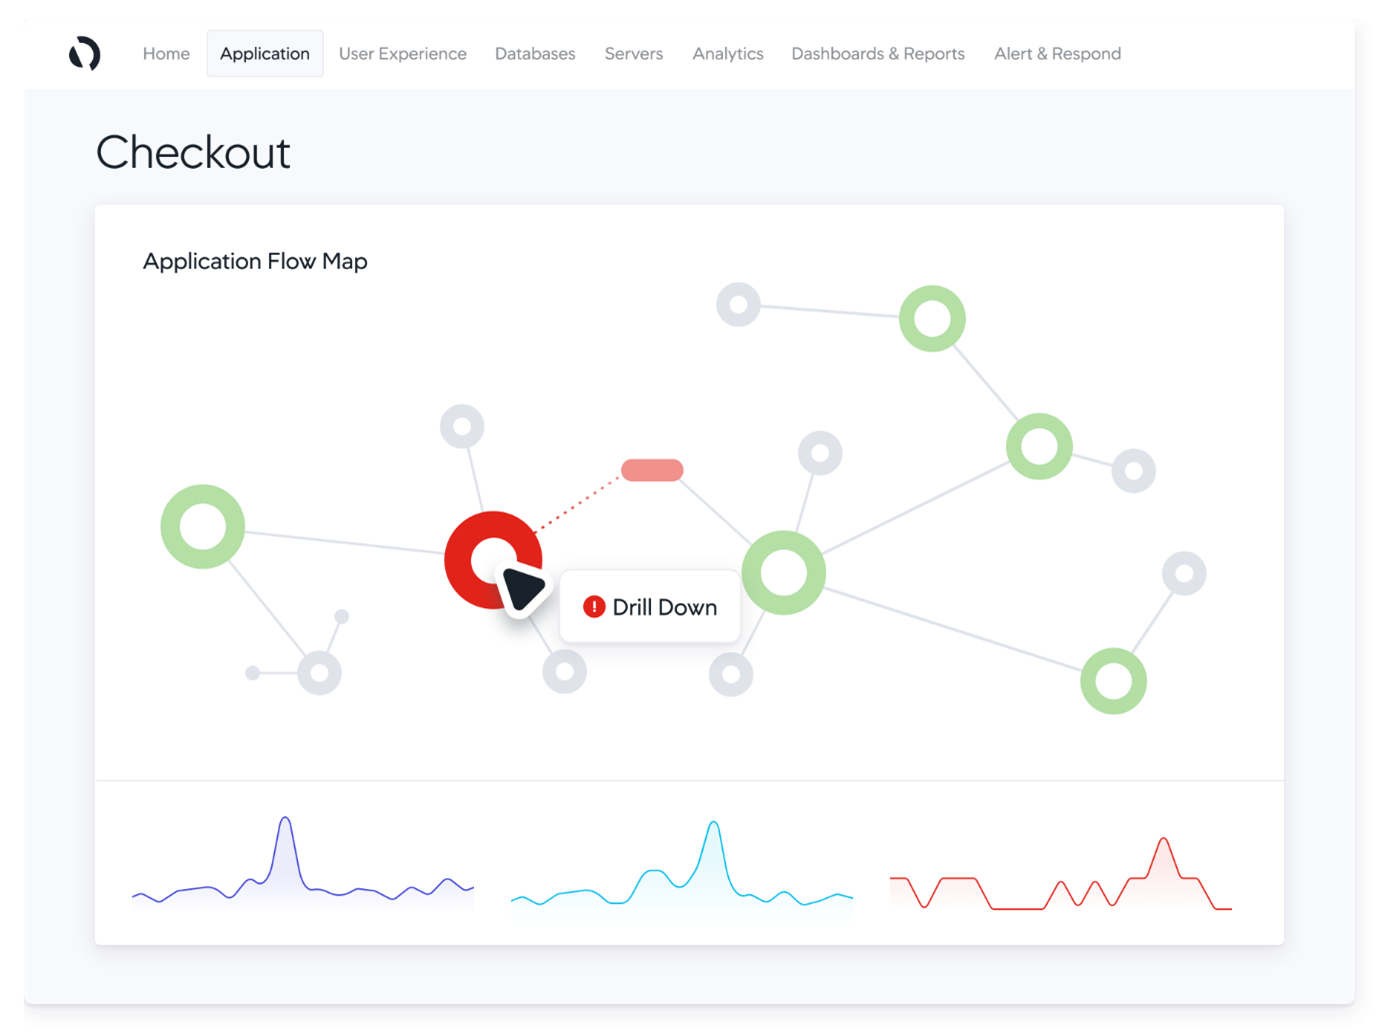
AppDynamics is an APM platform that uses analytics and end-to-end transaction tracing to determine how application performance impacts business outcomes.
Some of the key features provided by the App Dynamics distributed tracing tool includes:
- Achieving end-to-end business transaction visibility across web and mobile apps
- Monitoring your end-user experience across the globe through a single pane of glass
- Providing real-time anomaly detection
5. Dynatrace
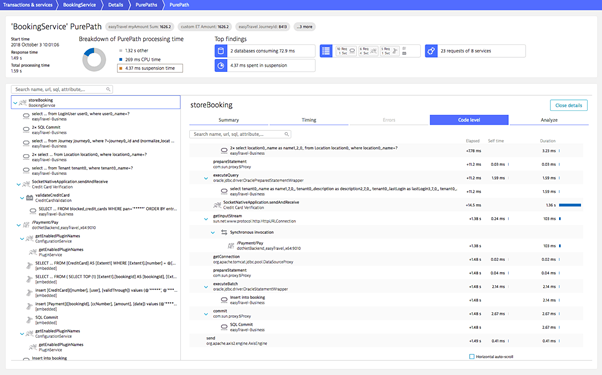
Dynatrace is a comprehensive SaaS tool targeting a broad spectrum of monitoring needs of large-scale enterprises. It provides a technology called Purepath, which combines distributed tracing with code-level insights. When a user initiates a transaction with the application, PurePath gives the transaction a unique ID.
Some of the key features provided by the Dynatrace distributed tracing tool includes:
- Automatic injection and collection of data
- Code-level visibility across all application tiers for web and mobile apps together
- Always-on code profiling and diagnostics tools for application analysis
Contemplating Dynatrace and Turbo360 ? Explore our breakdown: Dynatrace vs Turbo360
6. Nodinite
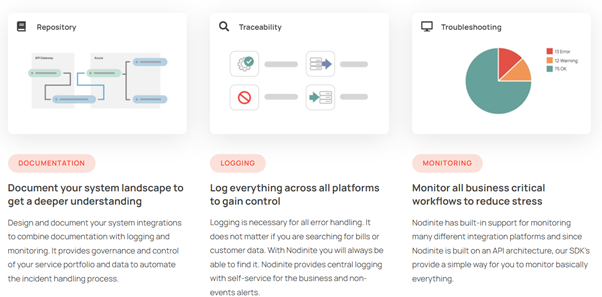
Nodinite provides a single platform to monitor and manage your Azure-based integrations and track all messages. It offers end-to-end logging and monitoring. Some operational features are available for Azure Logic Apps, Azure Service Bus, Azure SQL Databases, Azure API Management, and Azure Functions. You can get a quote for pricing details.
Contemplating Nodinite and Turbo360 ? Explore our breakdown: Nodinite vs Turbo360
Choosing the right distributed tracing tool
Primarily all the distributed tracing tools operate on the exact mechanism. The messaging system includes an identifier field to which each microservice adds a number. This identifier gives a trace through the microservice hierarchy and enables monitoring tools to identify the structure that serves an app.
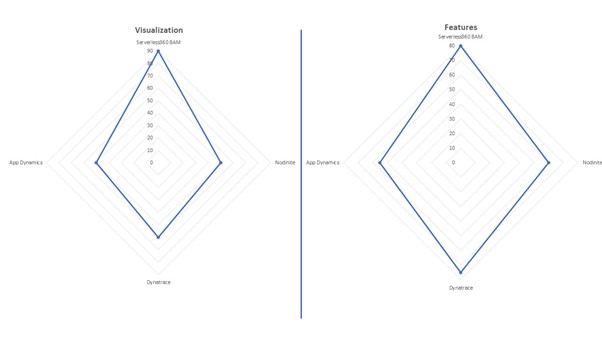
Thus, choosing the right distributed tracing tool depends on the visualization these tools offer and the extra features like monitoring, dashboards, customization. Considering visualization, Turbo360 BAM is the quick win as it displays the entire flow of the business process.
Conclusion
Each distributed tracing tool in the market is built with a purpose and has some advantages and disadvantages over others. Choosing the right distributed tracing tool is depended on your needs and budget. Sometimes we get all the features we need in a tool, but it will cost way more than our budget. So always try the tool, get hands-on experience, and decide your option.
 INTEGRATE 2026 | The Largest Microsoft Integration Tech Conference -
