In this blog, we will explore how distributed tracing works in Application Insights and how to use it to diagnose the issues in a distributed application.
Azure Application Insights is a powerful tool for monitoring and diagnosing application performance issues and supports distributed tracing. It is an extension of Azure Monitor and provides Application Performance Monitoring features out of the box.
The emergence of microservices architecture has led to the rise of independently deployable components that increase the availability of the application and decrease the cost. With more independent components comprising a distributed application, the communication between those components becomes complex and overhead to maintain.
Also, as the use of distributed applications increases, distributed tracing has become even more critical, enabling us to see how the data flows and how data is processed through such complex systems.
How distributed tracing work?
Distributed tracing is a technique that allows us to track the request as it flows through different services and components of a distributed system by tagging it with a unique identifier.
The SDKs provide APIs for creating and managing spans, representing a unit of work within a trace. Trace is the entire flow of a request. Spans can be nested to represent sub-operations within a request.
When an application receives a request, the SDK creates a new trace and span for the request. The SDK generates a unique trace Id and span Id for the request and propagates them to downstream services using the HTTP headers. As the request flows through the system, each service creates a new span for the work it performs and sets the parent ID to the ID of the span it received.
When the request completes, the SDK sends the trace data to the Application Insights service, which is stored and analyzed. The logged traces can be visualized in the Application Insights portal to diagnose performance issues.
Enabling distributed tracing using Application Insights
The Application Insights SDK supports several tracing libraries. Distributed tracing can be enabled across the components of a distributed application in the following ways.
Application Insights SDK
Application Insights provides SDKs for the following languages that support distributed tracing natively. It provides a set of APIs for instrumenting the application and capturing the trace data.
- .Net
- .NET Core
- JAVA
- Node.js
- JavaScript
- Python
Dependency auto-collectors automatically collect the tracking information when the SDK is installed and configured correctly. The collected dependencies can be visualized in the Application Map section.
OpenTelemetry
OpenTelemetry is an open-source project that provides a set of APIs, libraries, and agents for collecting distributed traces and metrics from the distributed system. OpenTelemetry SDK is available in the following languages.
- .Net
- JAVA
- Node.js
- Python
OpenCensus
In addition to Application Insights SDK, Application Insights offers support for distributed tracing using OpenCensus. It is an open-source, vendor-agnostic, single distribution of libraries that provide metrics collection and distributed tracing.
All the above offerings enable distributed tracing across an application but also have certain limitations that must be analyzed before choosing the right offering.
Sample scenario
Consider an order processing scenario where a user requests orders from the Azure Web App. The placed order request is sent to Service Bus Queue. A Service Bus Queue receives the triggered function, and the order request is uploaded to Azure Storage after further processing.
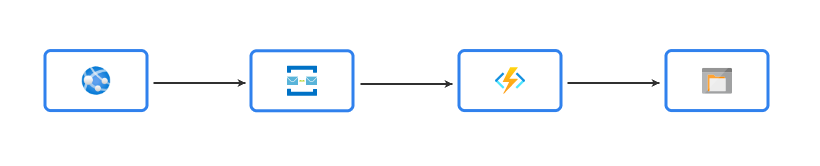
In this flow of an order request, exceptions or performance bottlenecks can occur in any of the above components. It will hinder the growth of the business. To encounter such scenarios and ensure smooth business flow, distributed tracing is required. Let us see how we can diagnose an issue in the above system by enabling Application Insight to the Azure Function App.
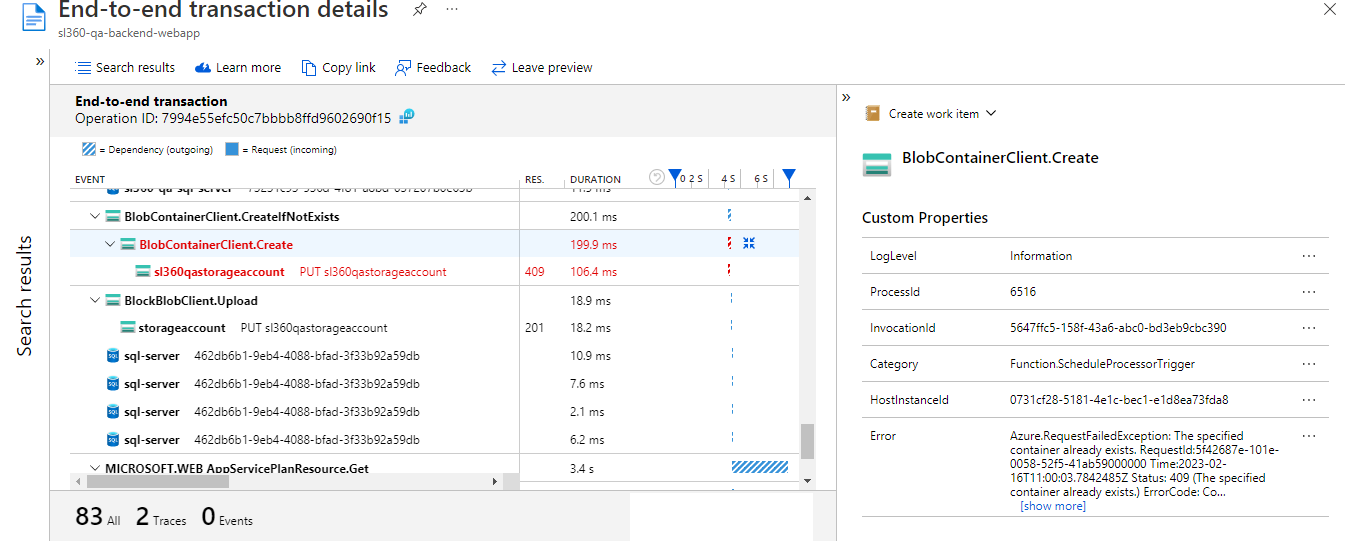
Using the Application Map feature in Application Insight, we can see an issue while uploading the requested order from the Function to the Storage.
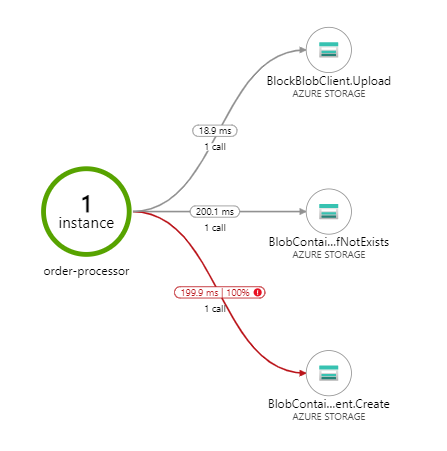
To get further details about the failure, navigate to the “End-to-end transaction details” section. This section provides a detailed view of a single request as it flows through different components. This can be used to pinpoint the error.
Distributed tracing is a powerful technique for diagnosing issues in a distributed system. Using Azure Application Insights, we can capture the trace data. This data can be used to gain end-to-end visibility into the application’s performance and flow, helping identify and resolve performance issues efficiently.
Limitations
Application Insights come with certain limitations.
- Monitoring as an application is not feasible.
- No built-in support for different notification channels like teams, Slack, PagerDuty, etc.
Let us see how we can overcome these limitations using Turbo360 BAM.
Turbo360 BAM
Azure Distributed Tracing Tool by Turbo360 allows users to monitor and analyze their business processes and workflows in real-time. With BAM, users can track the progress of their end-to-end business activities and identify any issues or bottlenecks that may arise.
There are three main terminologies to understand before going further.
- Business Process represents a business workflow. It is defined as a group of business transactions.
- Transaction represents an operation of the business. It is defined as a sequence of actions or stages.
- Stage represents a process or action that performs a business operation.
The stages in a business transaction can be present in any of the following Azure Integration Services: Logic App, BizTalk Server, Azure Function, APIM, Power Automate, etc. Turbo360 BAM also helps us track the stages in any on-prem application through .Net library.
In Turbo360 BAM, tracing is achieved using checkpoints, which are specific events within a tracked business process. The user can configure these checkpoints to suit their specific business requirements.
Once the checkpoints have been configured using the Turbo360 connectors or API, Turbo360 can begin monitoring and analyzing the tracked data. This data can be used to create dashboards and reports that provide insights into the performance of a business process, such as average processing times, the number of orders fulfilled, and any errors or issues that occurred during the process.
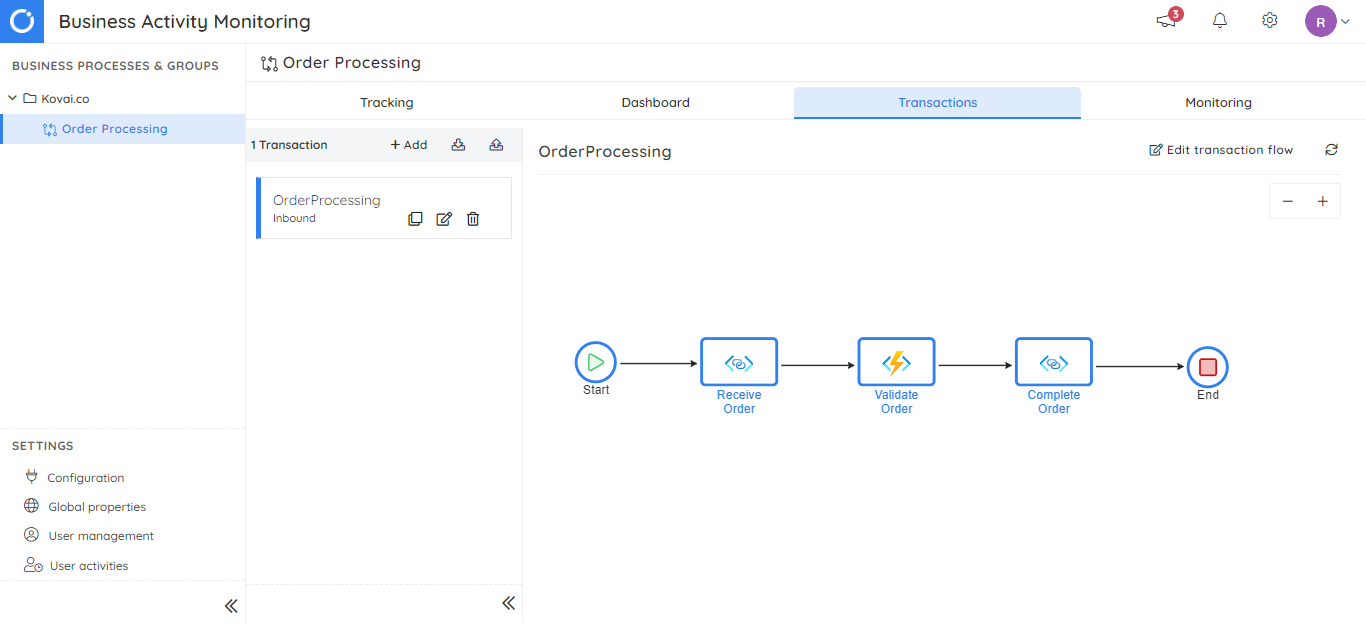
The sample scenario discussed above can be configured as a transaction, as shown below.
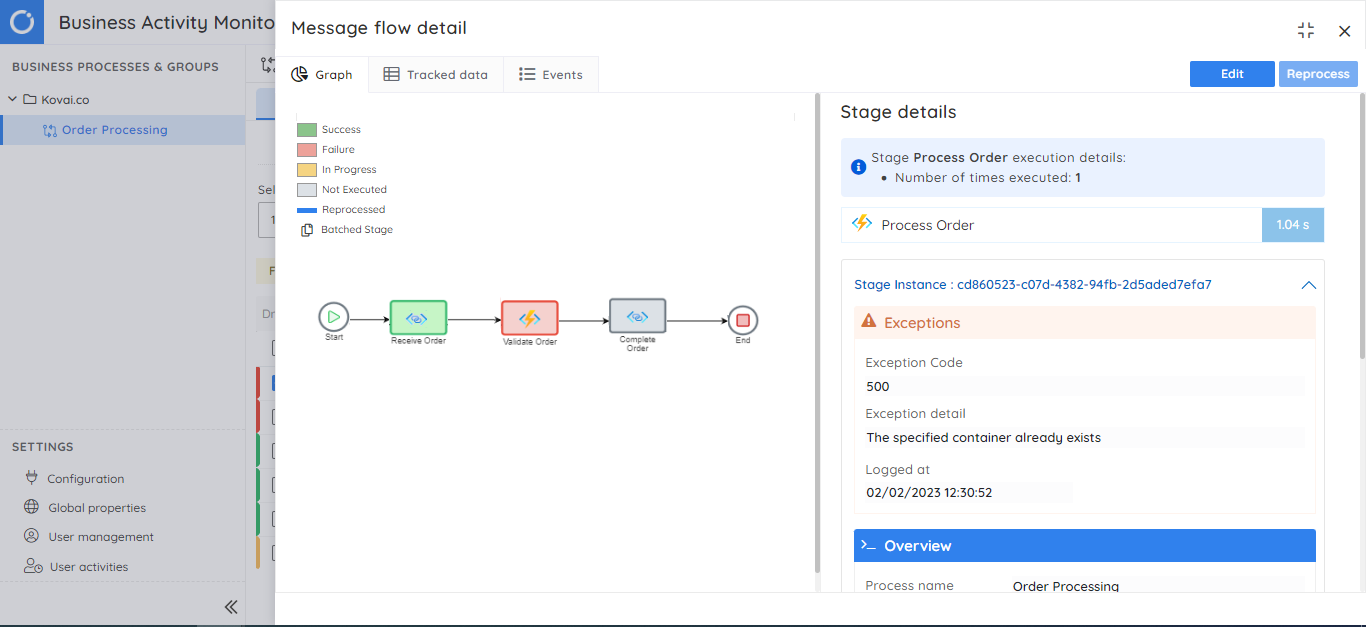
Once the required BAM instrumentation is done, the business flow will be tracked below.
Apart from visualizing the end-to-end flow of data in the system, monitoring can be performed from different perspectives using the tracked data.
- Duration monitor performs monitoring based on the execution time taken by transaction instances and their stages with an in-progress state.
- Exception monitor alerts the required set of audiences whenever there is an exception in the stages of a transaction.
- Query monitor performs monitoring based on the number of transaction instances matching a particular query.
Turbo360 BAM offers more enhanced tooling, do check out here for more details.
Turbo360 Business Applications
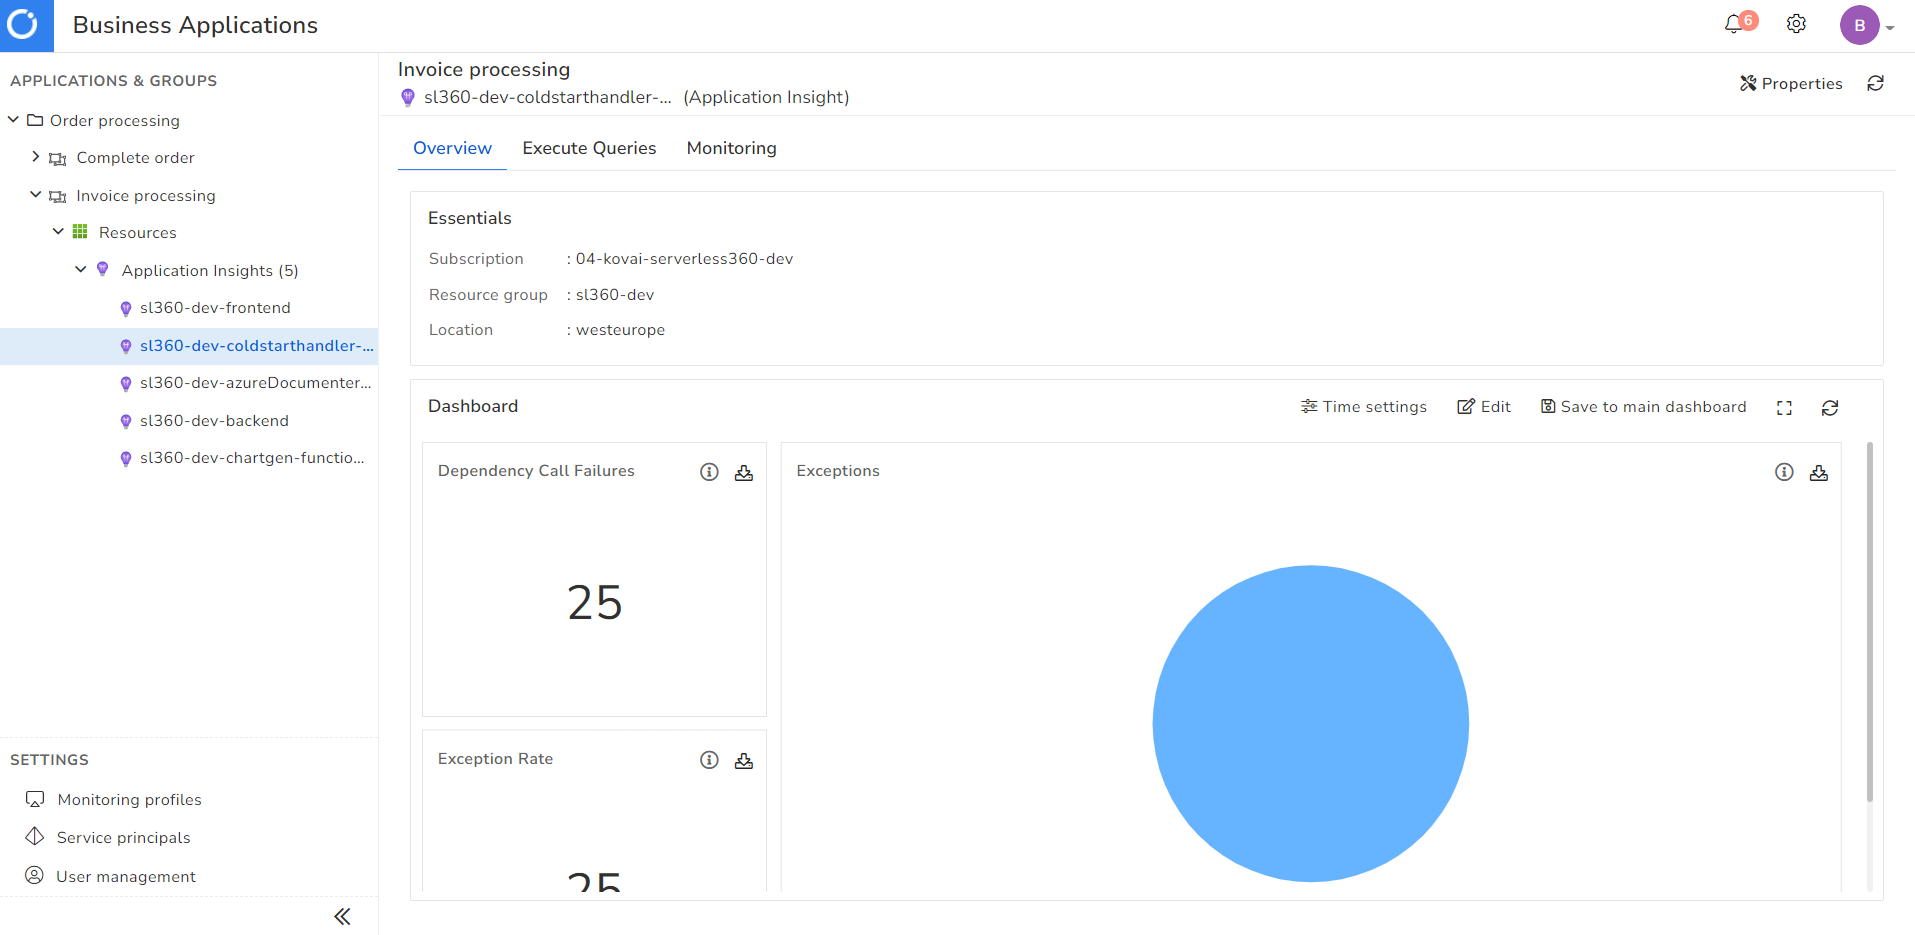
Turbo360 Business Application allows grouping of Azure Services like Azure Functions, Logic Apps, Event Grid, Service Bus, etc., constituting a Business Solution in a logical container called Business Application. These services can be from different Azure Subscriptions, Regions, and Resource Groups.
Once these services are added to the Business Application, monitoring and management operations can be performed on these resources. Now let us add the Application Insight to Business Application. When its added , a default dashboard with multiple pre-defined widgets is created automatically, allowing us to visualize real-time data.
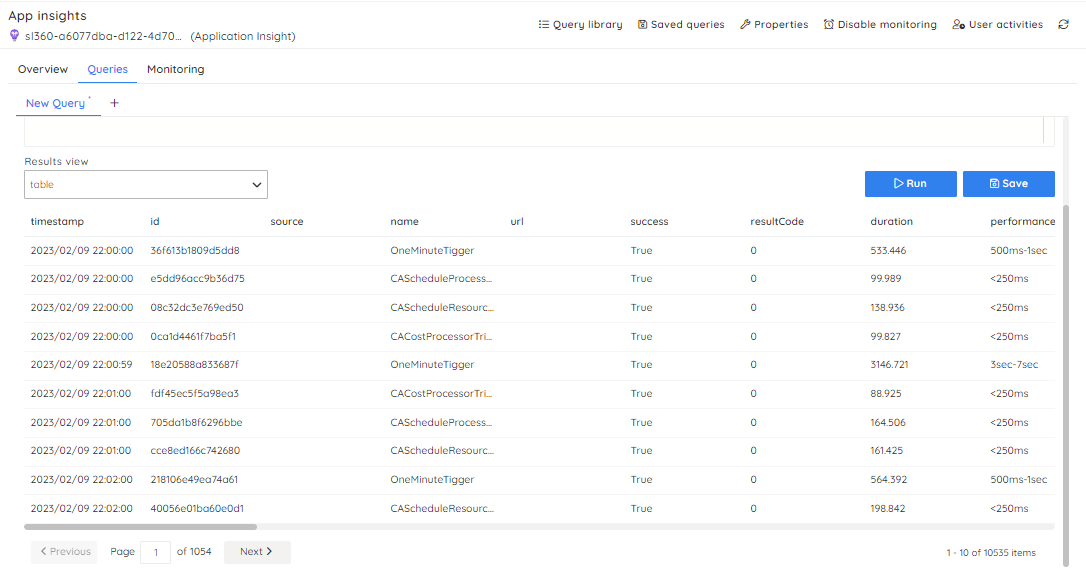
Turbo360 also provides the capability to execute queries on the added Application Insight. results of the queries can be visualized in different formats like tables, charts, etc.
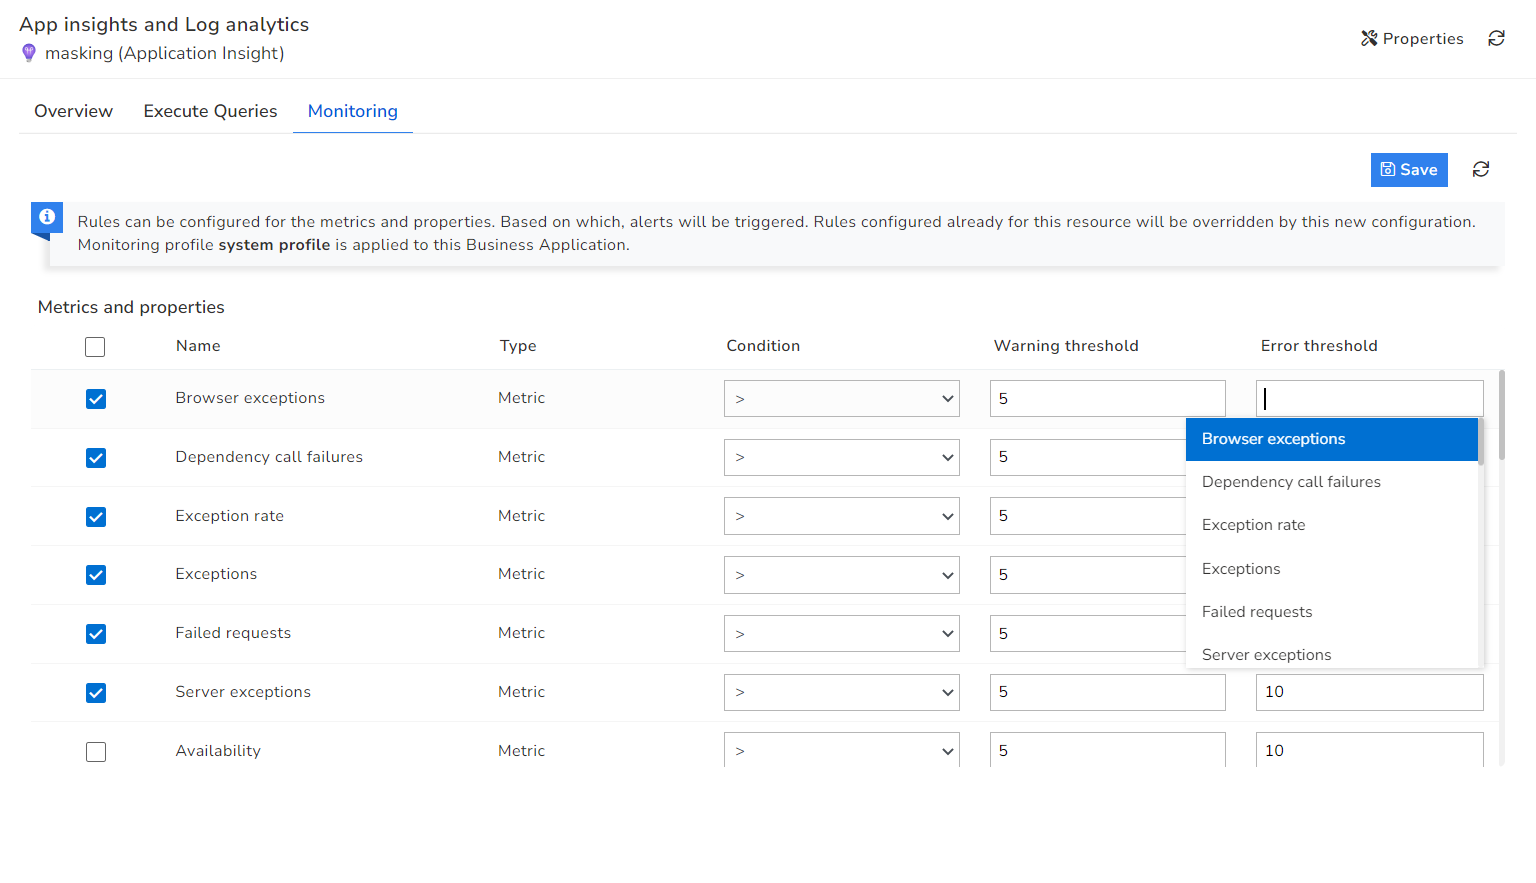
Apart from visualizing the data, Turbo360 goes a step further, allowing to configure monitoring based on the queries.
Monitoring can also be configured based on the metrics of the Application Insight resource.
Along with the above-discussed capabilities, Turbo360 also provides monitoring, documenting, cost analysis, and management capabilities for Azure resources. These features, together, give a comprehensive understanding of the performance and behavior of an application.
Compare Application Insights vs Turbo360 to get a deeper understanding.
Conclusion
In this blog, we have discussed the importance of distributed tracing in a distributed system and how to achieve distributed tracing with Application Insights. We also analyzed how Turbo360 BAM and Business Applications can visualize and monitor the end-to-end flow of business solutions. Start your 14-day free trial now!