Introduction
The Azure portal has the capability for endpoint monitoring by continuously pinging the website and checking its status from different parts of the world. This helps to ensure the high availability of the applications that are resilient to endpoint failure and Azure regions failures. Endpoint monitoring facilitates to keep the Web App become up in all the time and notify in case of any failures.
Azure Web is the most widely used Azure service that helps to host your web applications in Azure. By using Azure Web App, we can host our user interactive web applications or backend services like WCF service or Web API’s, etc.,
Azure Web Apps provides high Availability, Scalability, and Security for the hosted applications. We can build a Web App using the following technologies .NET, PHP, Java, Node.js and Python, etc.,
In Azure Web App we need to move our application bundle, then Azure App Service will take care of the remaining part of required operations to keep it running. While using Web apps, we can use the DevOps feature to deploy our applications directly from source code repository like Visual Studio Team Services, Git Hub, etc.
Azure Web Apps support up to two endpoints for endpoint monitoring. Every endpoint can be managed and verified from five different data centers. Endpoint monitoring can be configured through Application Insights.
Azure Web App Endpoint Monitoring Configuration
Web App endpoint monitoring was once available in the Azure portal, Now it replaced with Application Insights.
Create Application Insights
To make use of endpoint monitoring, Create / Enable Application Insights for your Web App as below
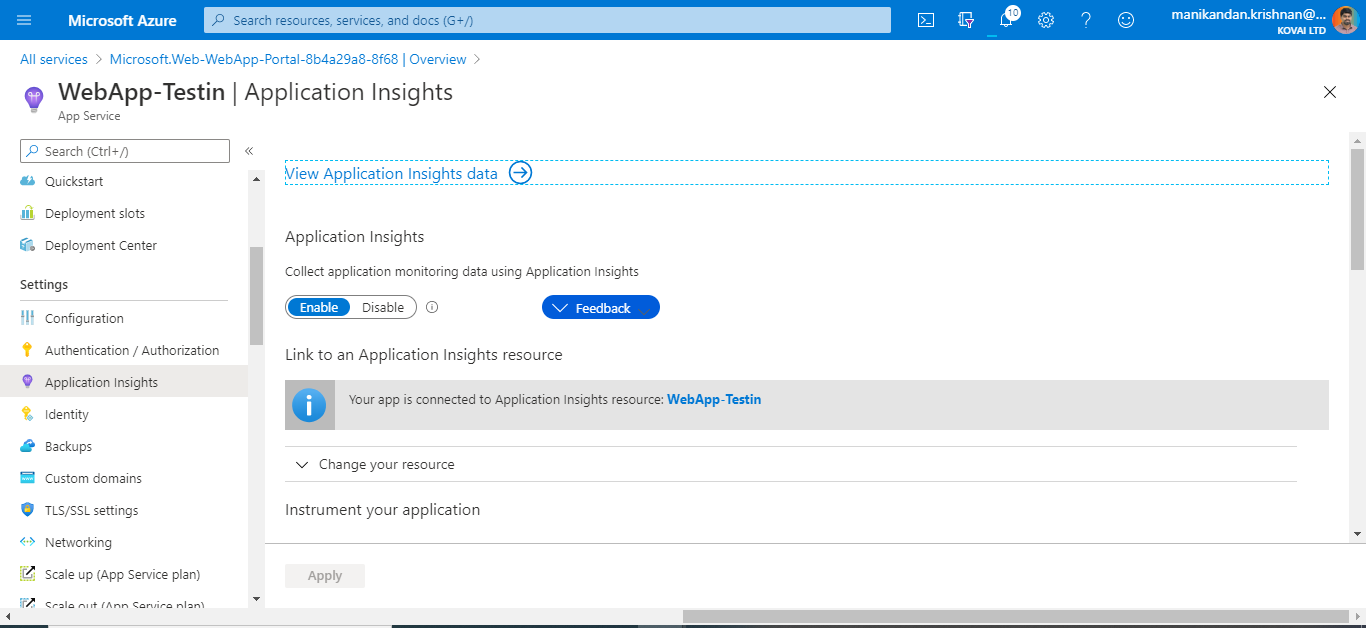
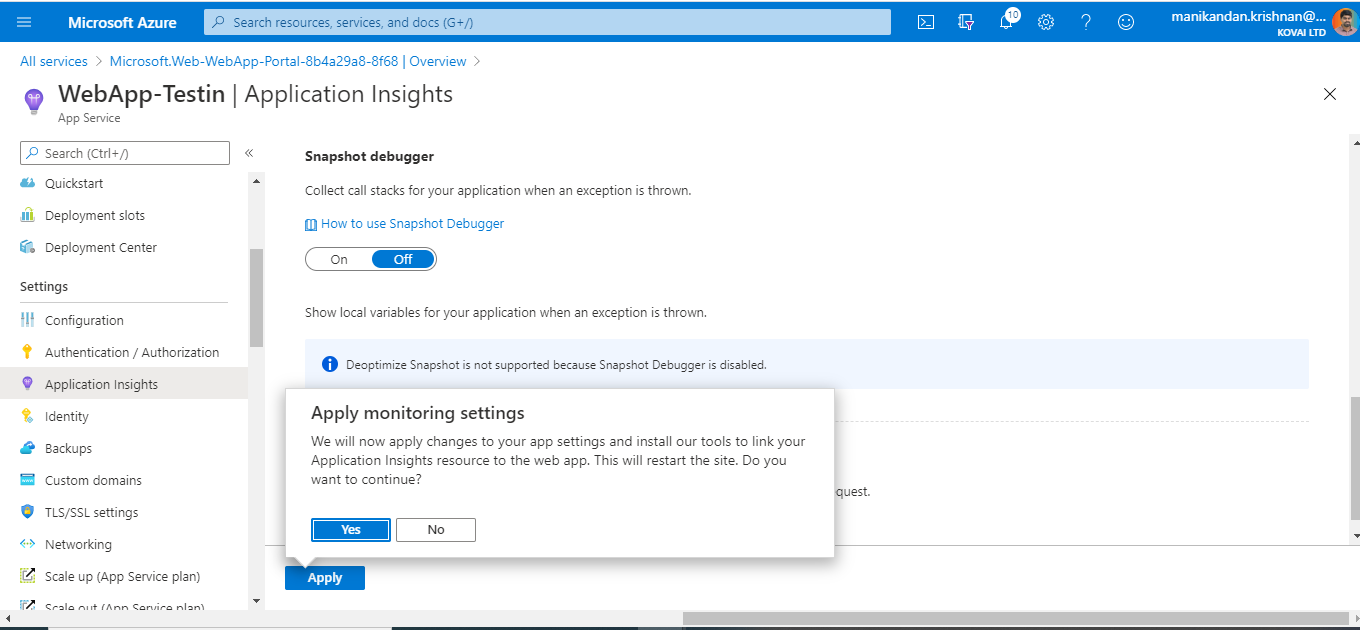
Click Yes to Apply Monitoring settings.
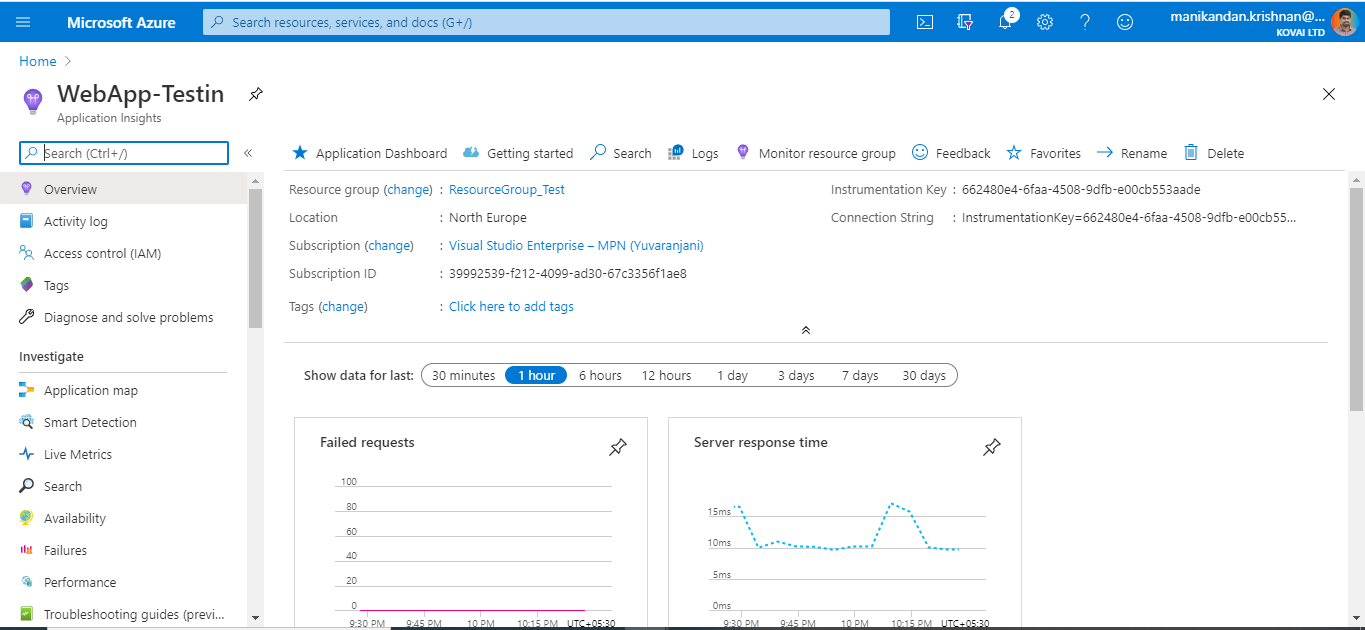
After creating or enabling Application Insights, click on the Availability from Application Insights -> Investigate -> Availability
For Web App endpoint monitoring the following configurations need to perform,
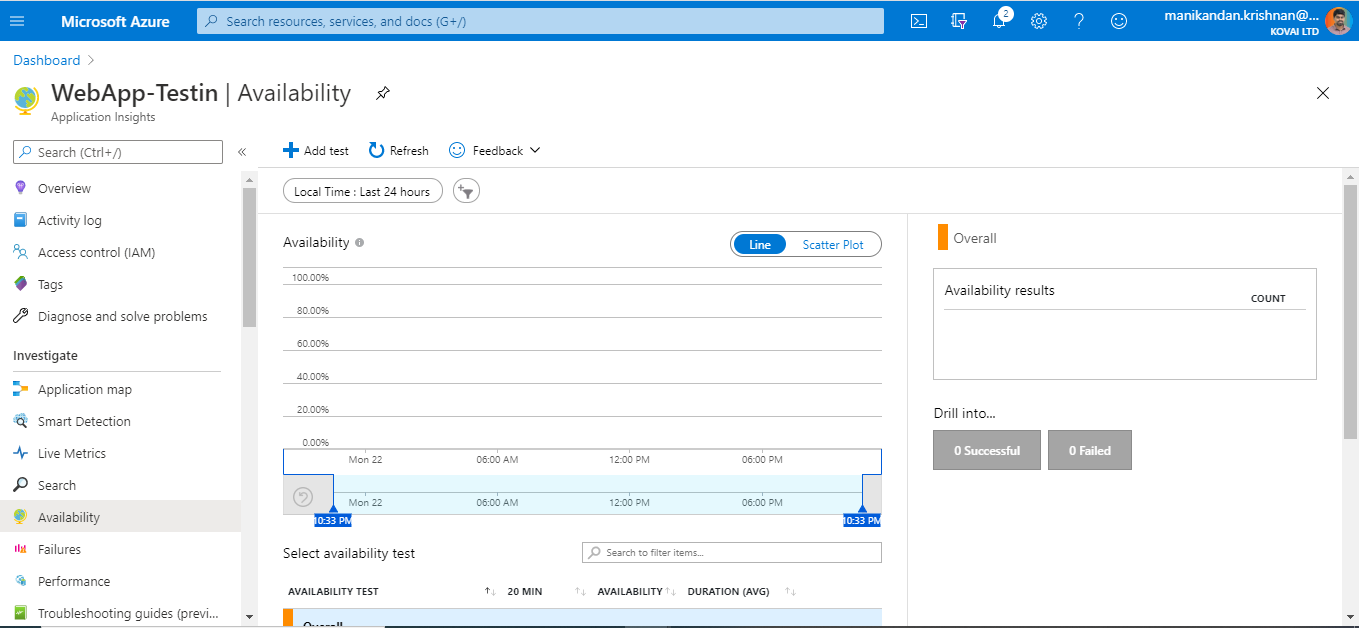
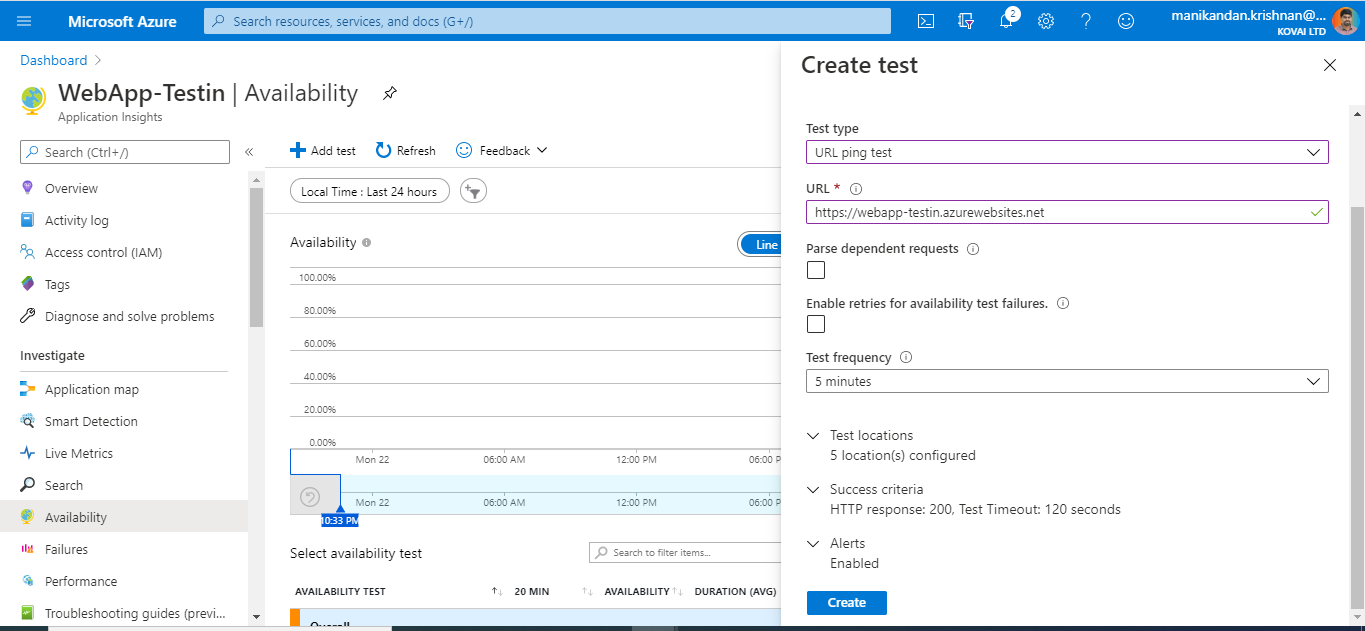
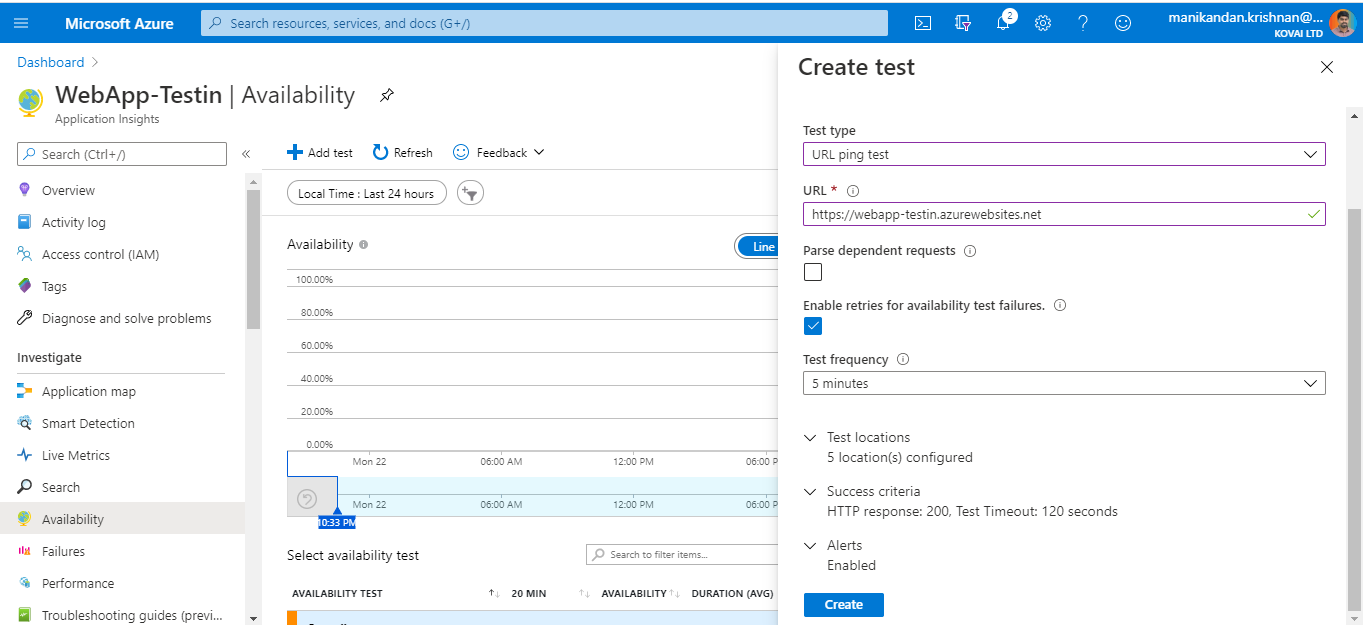
Click on the Add Test, the create test blade will open with the below-required details which need to be configured
- Test Name: Enter the test name to identify the test in the Management portal
- Test Type: Select URL Ping test, Multi-step web test option is also available
- URL: Specify the URL to test, this can be your Web App root URL or any single page which requires a health check/availability
- Test Frequency: The frequency at which this test will be executed periodically. Below are the available frequencies – 5 Minutes, 10 Minutes, 15 Minutes
- Test Locations: Azure will carry out the test from these specified test locations. By default, five locations will be configured. We can modify them later
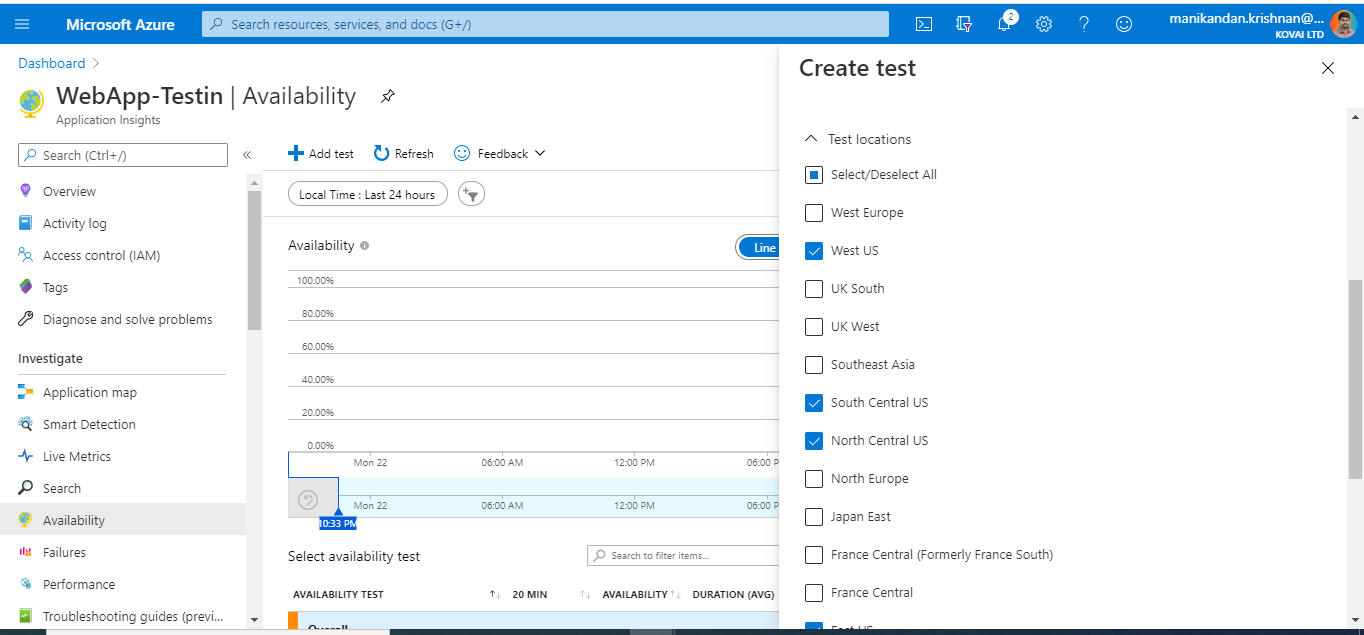
Available Test Locations
Select the required test location from the list of available test locations.
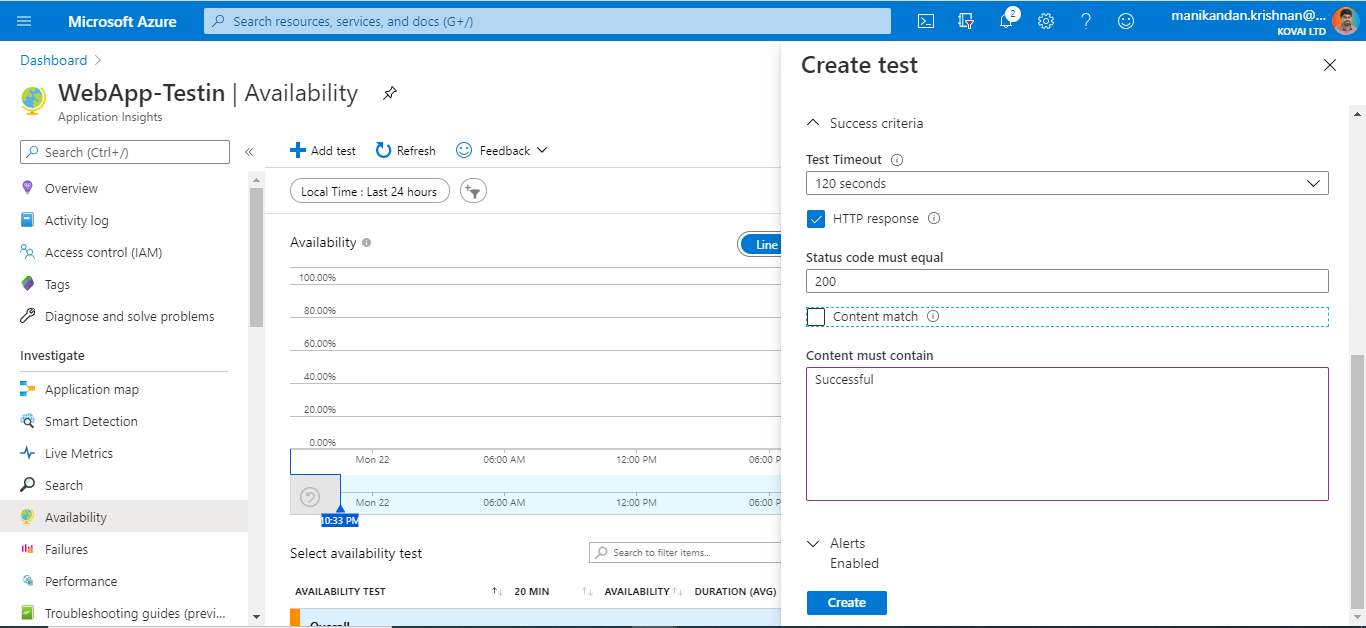
- Success Criteria: Configure the HTTP Status code to indicate the successful test or failed test
- Test Timeout: Test timeout used to mark the Maximum number of seconds for which the test should run
- Content Match: Enter the text that should be expected in the HTTP response
- Alerts: Enable / Disable alerts to notify the support team or administrators when there is a failure
Once the Web App test is created successfully, The Availability test will get displayed as below,
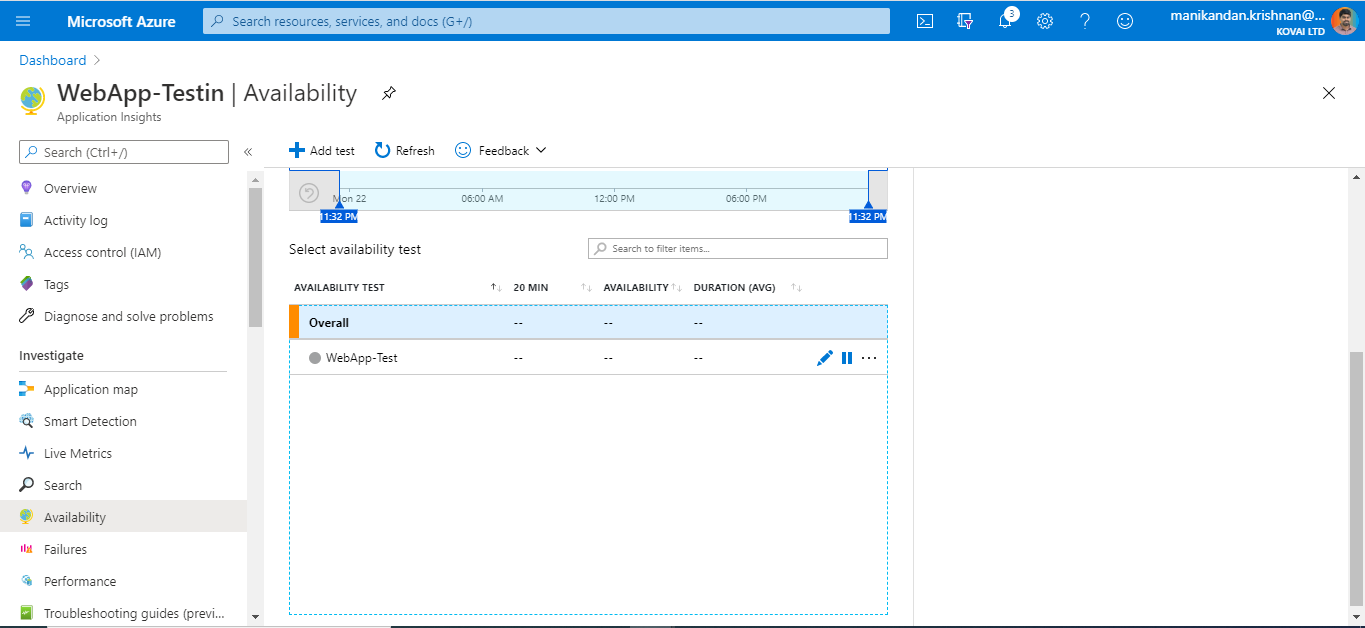
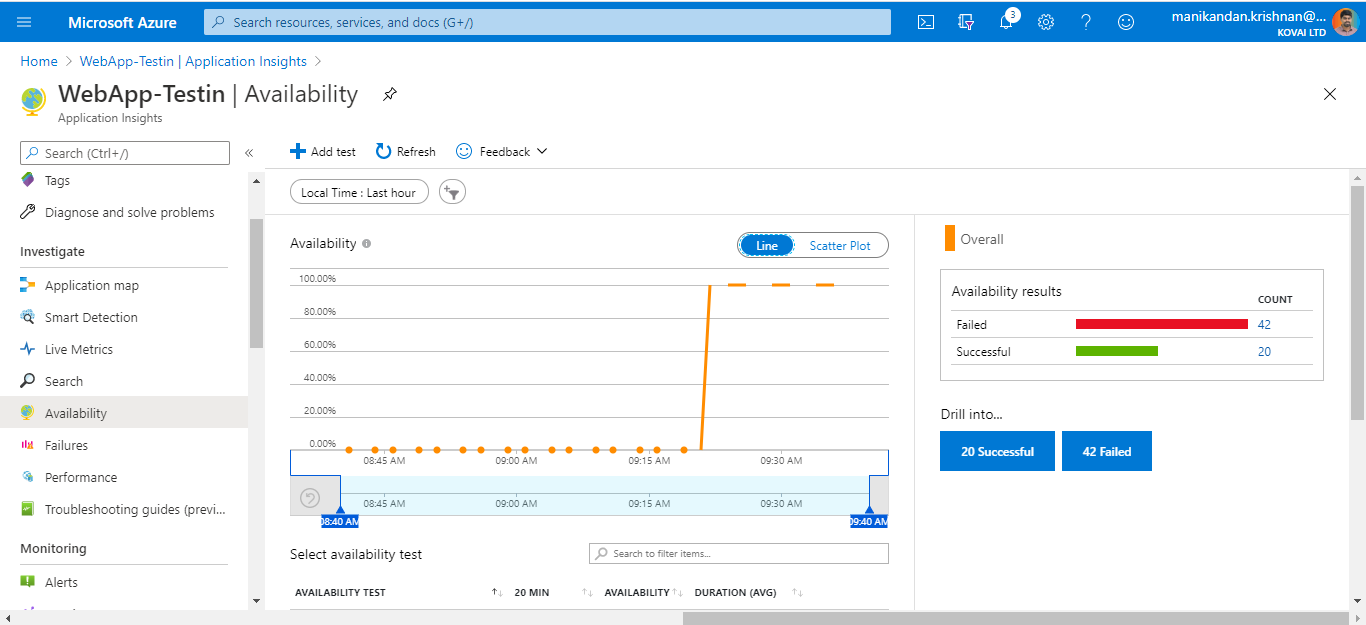
Availability of the Web App in the last 30 minutes, Line chart representation
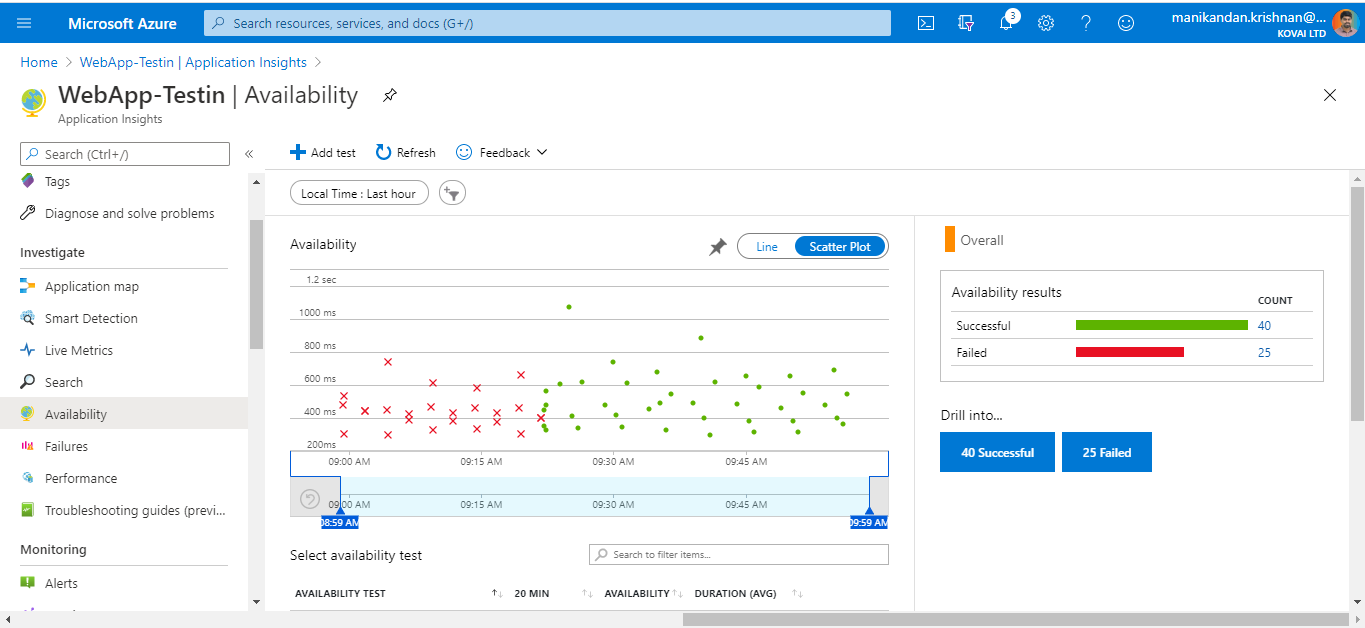
Availability of the Web App in the last hour, Scatter Plot representation

Application Insights
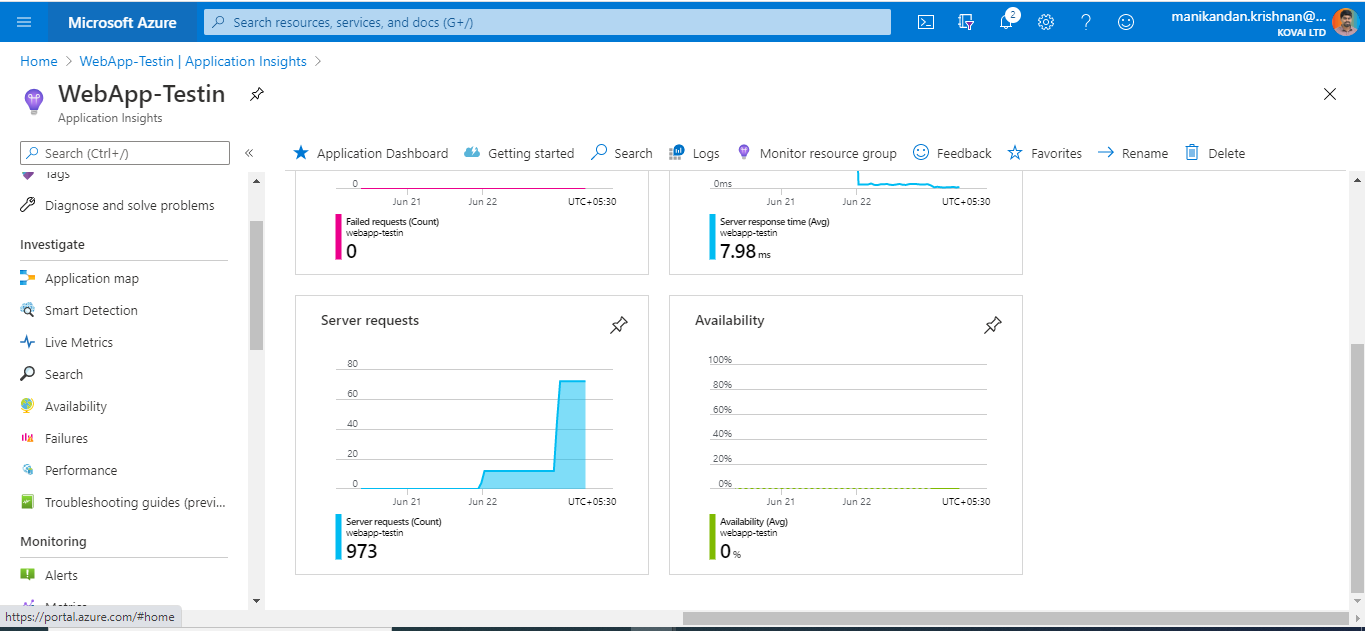
Using Application Insights, we can monitor the Failed requests and Server response time of the Web app in various frequencies.
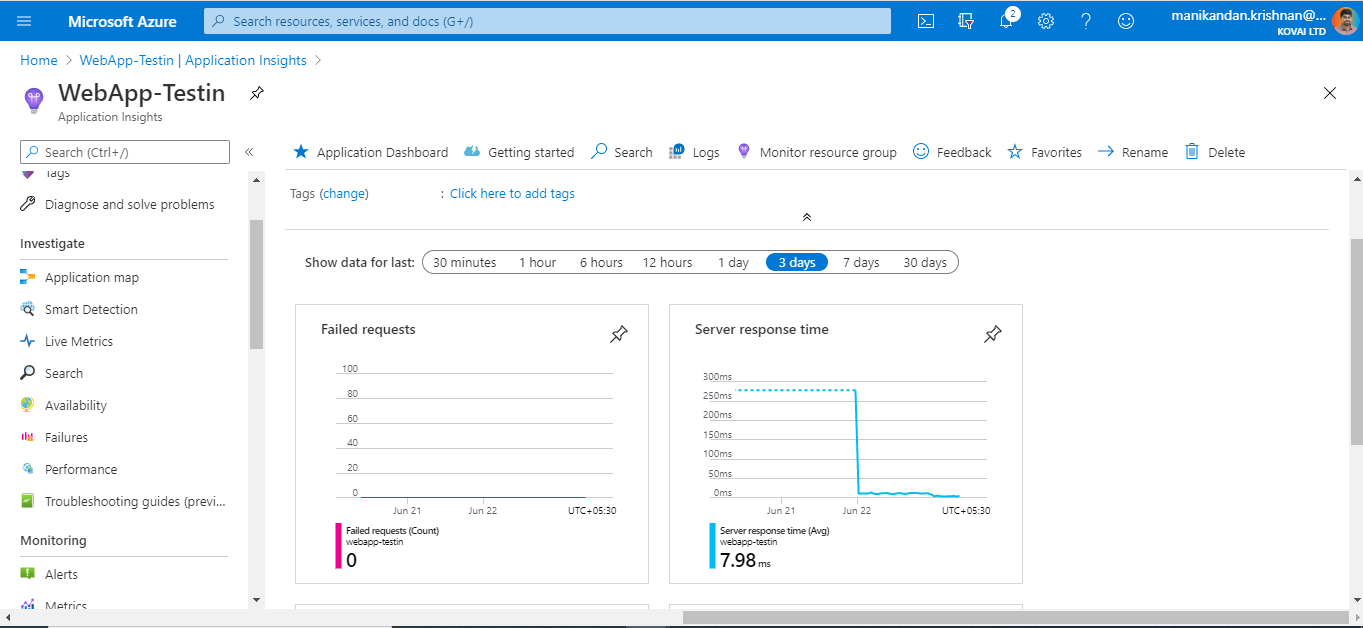
Also, we can monitor the Server request and Availability of the Web App under Application Insights.
Alerts
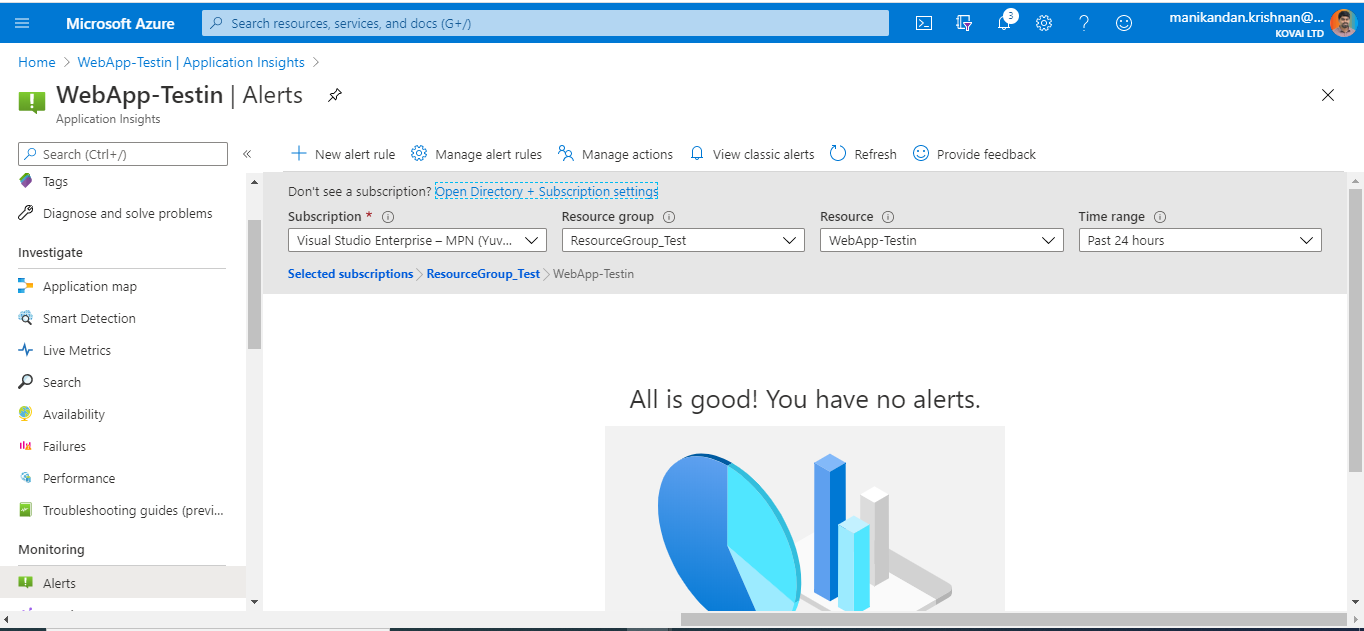
We can configure the alert with low, medium or high priority. We would receive a low priority alert within 15 minutes, when all the test locations encounter failure. When set to medium priority, an alert will be triggered in 10 minutes when at least half of the test locations encounter failure. The high priority alert will be triggered when all-time failure is detected in the Web App.
How Turbo360 handles Azure Web App Monitoring?
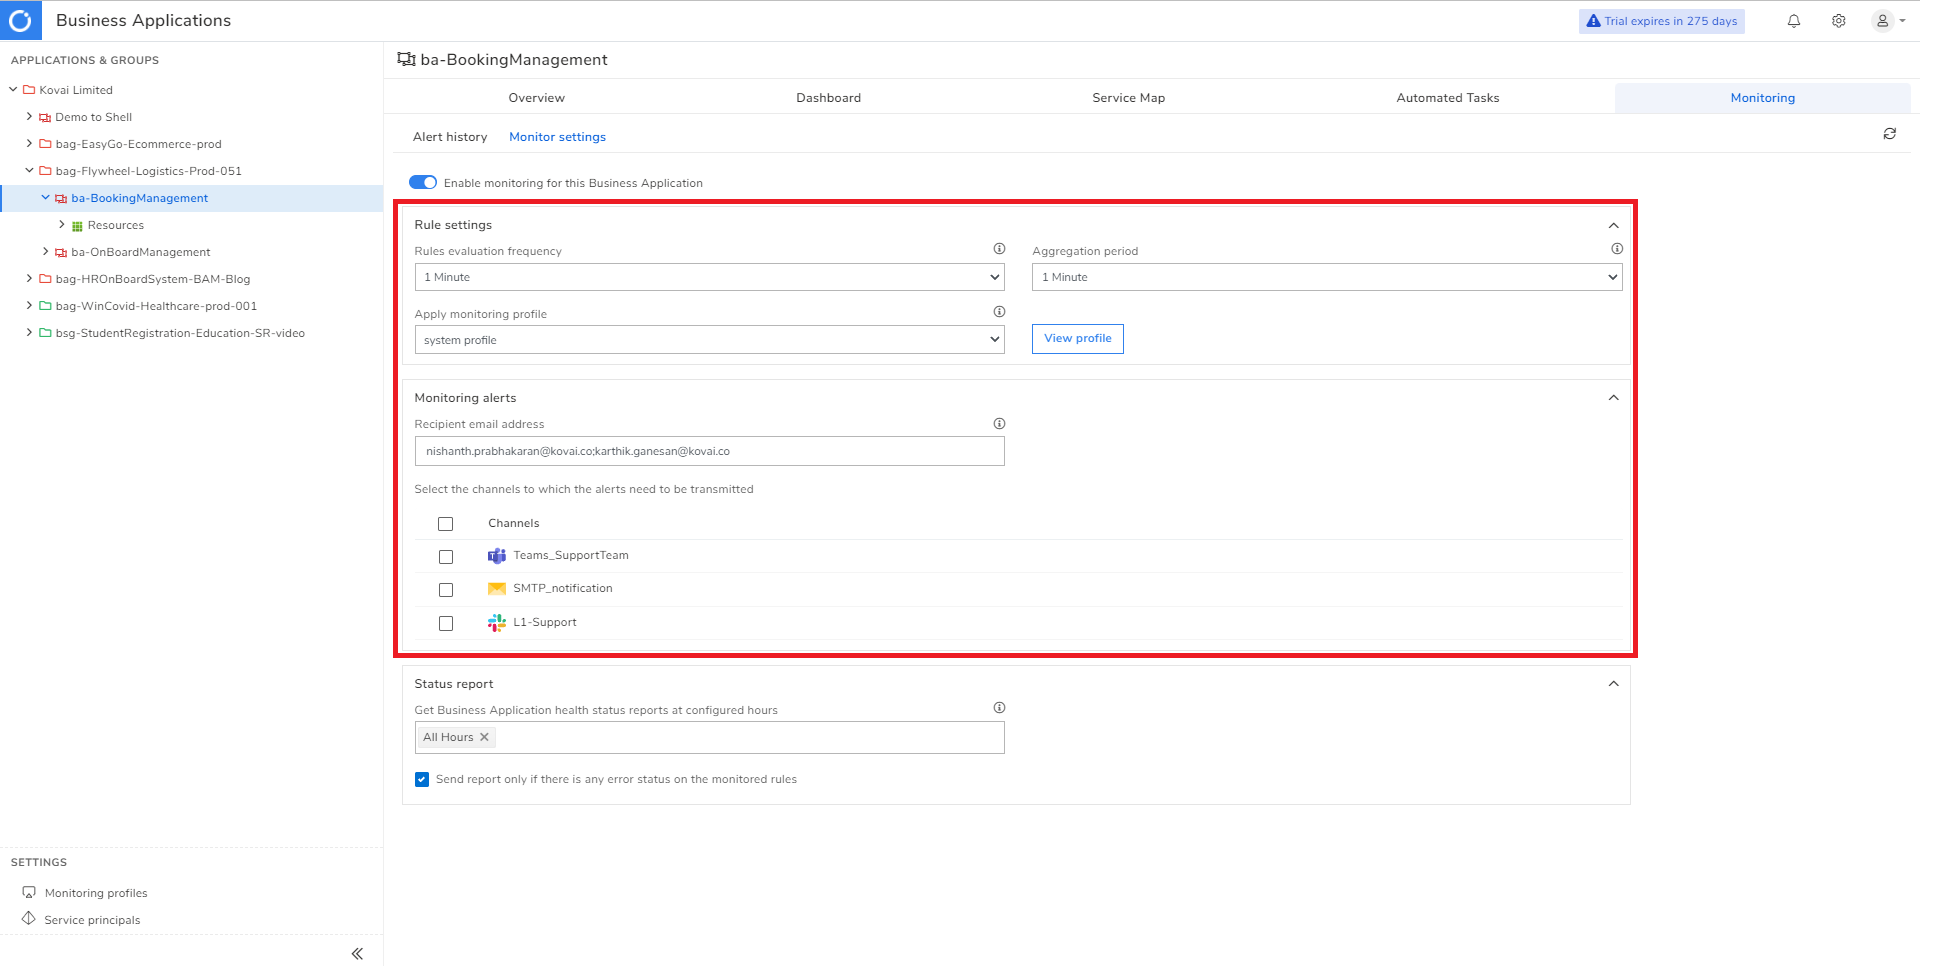
Turbo360 has extensive support for Azure Web App Monitoring with single monitor settings which allows to set Rules evaluation frequency, Status report, Monitoring alerts. Using Turbo360 we can monitor the Web Apps in multiple perspectives.
Performance monitor
In Turbo360 Performance Monitor can effectively monitor Azure Web App against an extensive set of metrics. We can configure the monitor with the below metrics – Average memory working set, Average Response Time, CPU Time, Data In, Data Out, Garbage Collections, Detect HTTP errors, Number of Request and Response Latency, etc.,
Through Performance Monitor we can monitor the state of the Azure Web Apps on specific days in a week and specific hours in a day based on the frequency configured. Alerts and status of the Web App can be notified through the configured notification channels.
One of the major advantages of Turbo360 monitors is you can get a detailed report of the different configured metrics of multiple Web Apps in a single consolidated report.
Status Report
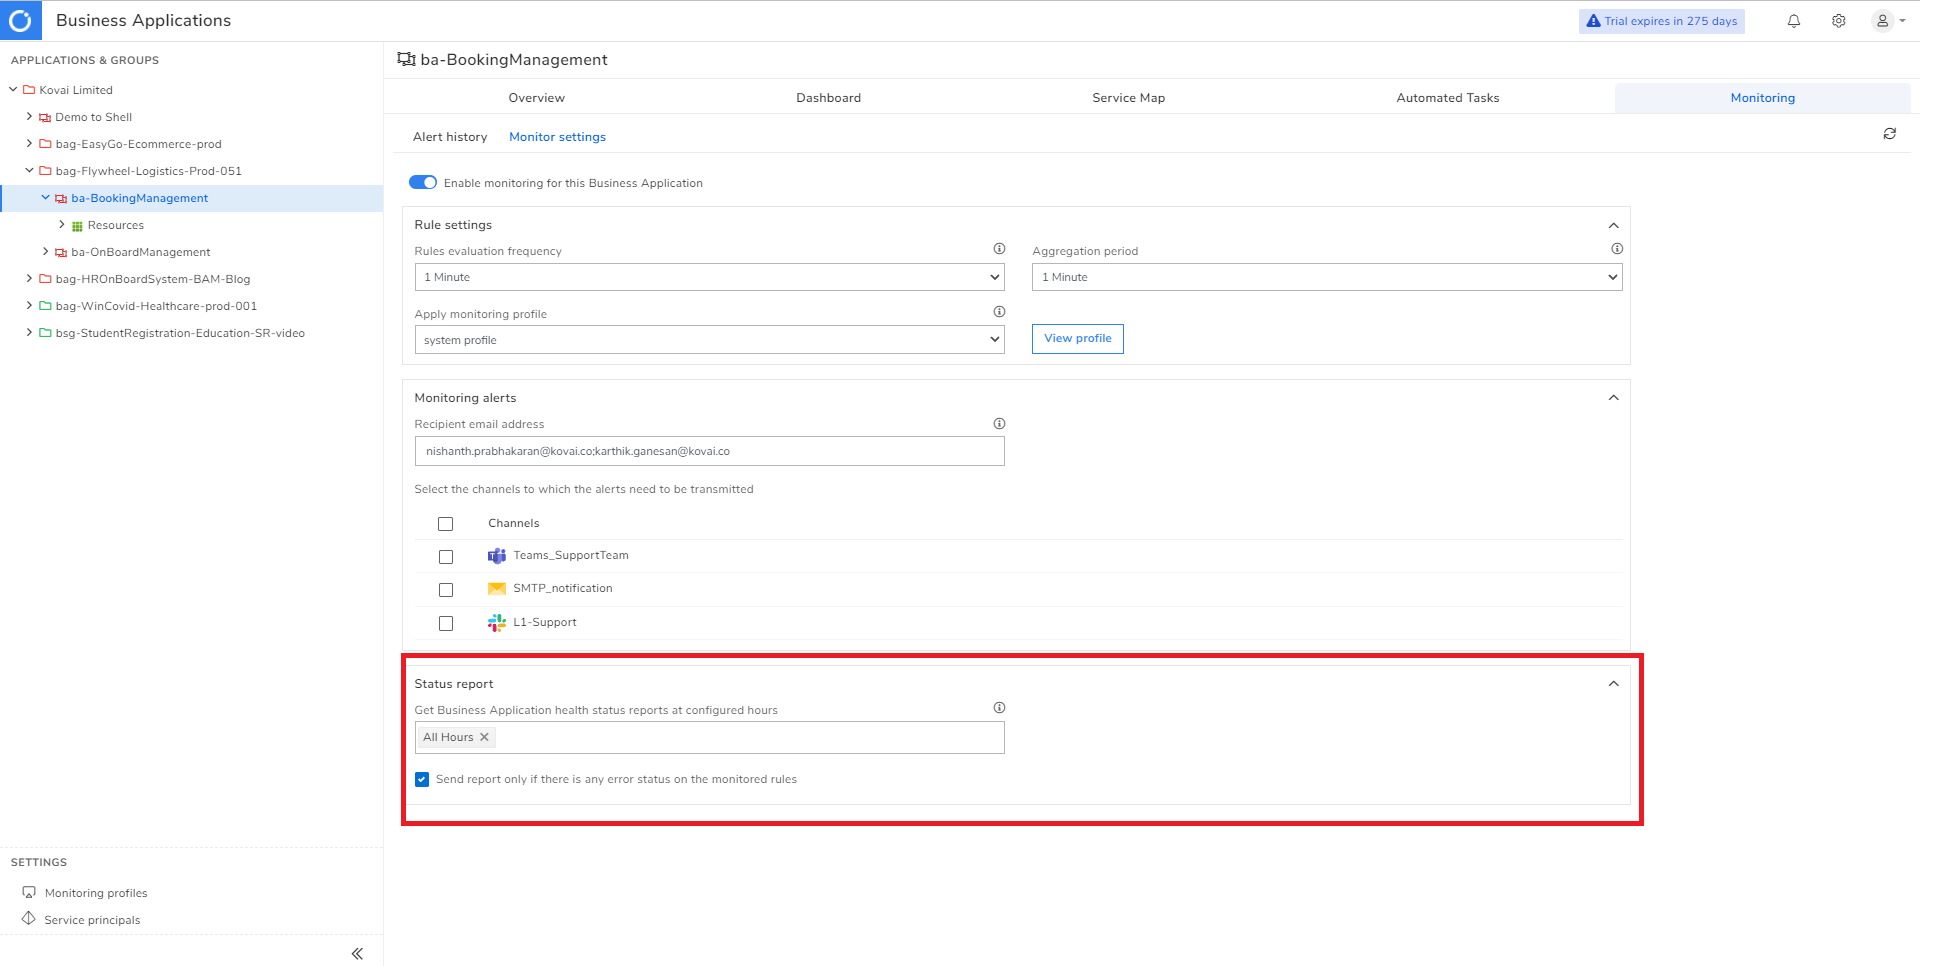
In Turbo360, Status Report can monitor the health status of Azure resources at regular intervals and generate a consolidated report at specific times in a day representing the state and properties of the resources against the desired values. Here we can monitor the status of all your resources from one place.
Status Report of Turbo360 for Web App Monitoring
API Endpoint Monitoring
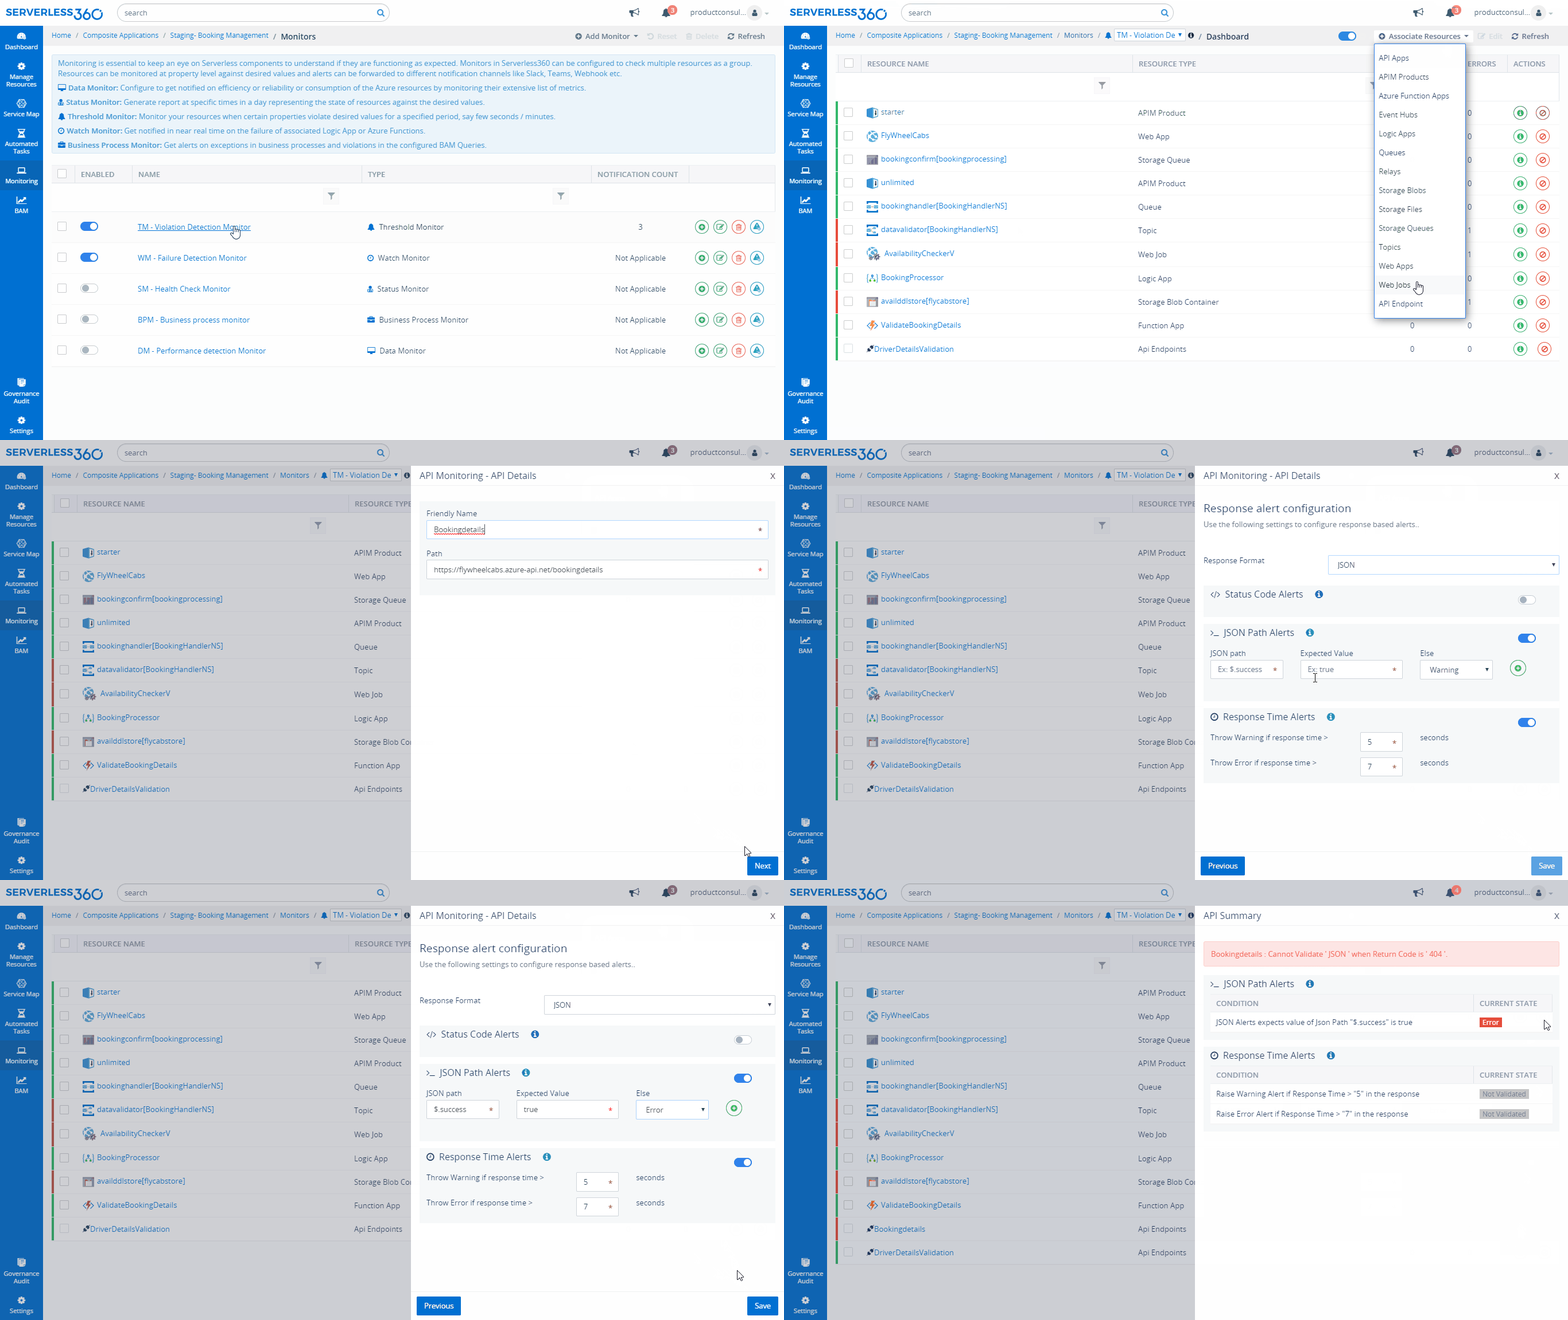
Turbo360 API monitoring helps to set up monitoring on the endpoints and get to know if the API is healthy. If there is a state mismatch, you will be notified of the error details so that you can immediately act on the API.
You can also configure the request to your endpoint by providing Authorization Credentials, Payload, and/or Custom Header. With the API Monitoring feature, you can monitor the endpoint based on Status Code, Keywords in the message body, and its response time. To summarize, the API endpoint can be monitored for its response and responsiveness.
Turbo360 supports two modes of authorization
- Basic Authorization
- OAuth Authorization
In basic authorization Username and Password is used to generate authorization token. In OAuth authorization, the authorization token is obtained from the user-provided Endpoint.
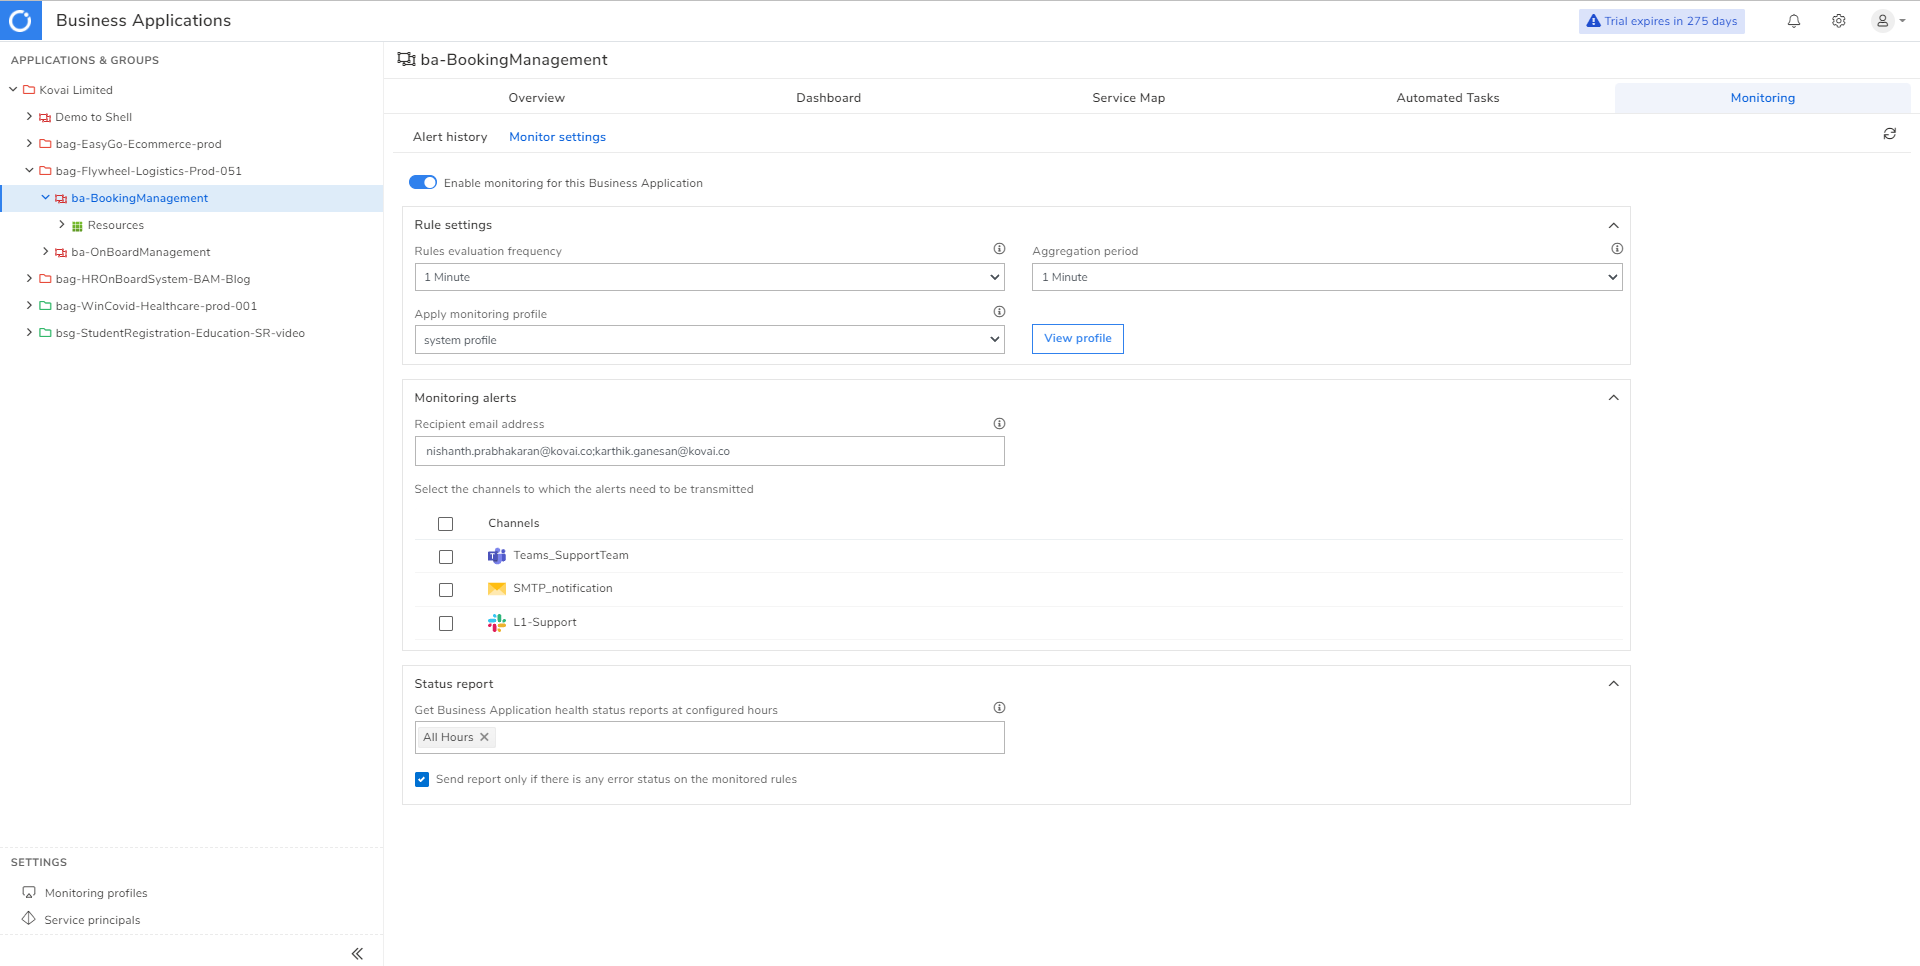
The API endpoint can be associated with Montior settings, with the Status report the API will be pinged at the configured time interval, and a report with status based on the expected response configuration will be shared on the notification channels.
With the performance monitor the endpoint will be pinged every 1 minute, in case of any error, the notification will be fired, also monitor API endpoint at a specified frequency between 5 minutes and 15 minutes.
Conclusion
This blog helps you understand about Azure Web App endpoint monitoring capabilities in the Azure portal along with how Turbo360 can complement the portal with its monitoring and management capabilities.
Also, check out our comparison blog on Azure API App vs Web App for a better understanding of its key features and benefits.

