Azure API Management is a Microsoft Azure cloud-based solution that helps businesses effortlessly create, publish, secure, and analyze APIs (Application Programming Interface). APIs are the building blocks of any business and play an essential role in data exchange.
Azure API Management monitoring is vital to enable the business to function seamlessly. It helps early problem detection, resource optimization, and data-driven decision-making to increase the quality of the API ecosystem.
Components of Azure API Management
The three main components of API Management service are an API gateway, a management plane, and a developer portal.
- The API gateway handles the routing of API requests to the respective backend services.
- The management plane provides access to features of the API Management Service. Azure portal, SDKs, etc., can be used to access it.
- As for the developer portal, it’s a user-friendly website that is both fully customizable and automatically generated.
Benefits of monitoring Azure API Management
Some of the main benefits of monitoring Azure API Management service are listed below:
Improved performance
Monitoring offers valuable insights into essential performance metrics of APIs, including factors like response times, latency, and throughput. These insights play a vital role in pinpointing performance bottlenecks and fine-tuning APIs to enhance user experiences and efficiently use resources.
Enhanced security
Monitoring allows for the detection and resolution of security threats and unusual activities. Any potential security vulnerabilities or unauthorized access to APIs can be spotted by keeping an eye on authentication and permission attempts. It’s of utmost importance to uphold the security and compliance of both APIs and the data they handle.
Increased reliability
Monitoring plays a crucial role in guaranteeing the dependability and availability of APIs. Downtime or service disruptions can considerably impact both business operations and customer satisfaction. Monitoring API Management can detect issues promptly, enabling proactive measures to minimize downtime and maintain service continuity.
Traffic analysis
Monitoring helps understand how APIs are used and provides insights on when they experience high traffic and which endpoints are most popular. This information is invaluable for deciding a system’s capacity, resource allocation, and infrastructure scaling to handle increased demand.
Error detection and troubleshooting
Effective monitoring also involves tracking and analyzing errors or exceptions in APIs. It helps pinpoint the root causes of problems and enables swift troubleshooting, reducing user disruptions and minimizing the support workload.
Cost management
Additionally, monitoring allows us to gain insights into the cost implications of API usage and traffic patterns. This knowledge can help discover opportunities to save costs and adjust API policies and pricing models accordingly.
How to monitor Azure API Management?
Azure Monitor is a centralized platform that collects, analyzes, and visualizes telemetry data from various Azure services, including API Management. You can configure monitoring based on metrics, activity logs, and resource logs to closely monitor APIs’ performance and health.
Metrics
Metrics are numerical values that provide insights about the resource that emits it, which can be used to determine the health and state of the API. The values are emitted at regular intervals and stored in a time-series database.
This data can be viewed in the Metrics Explorer of every Azure resource under the Monitoring section. Metrics Explorer represents the metrics in chart format, which can be visualized under different aggregations and dimensions. The metrics definitions and their corresponding values can also be accessed through the REST APIs.
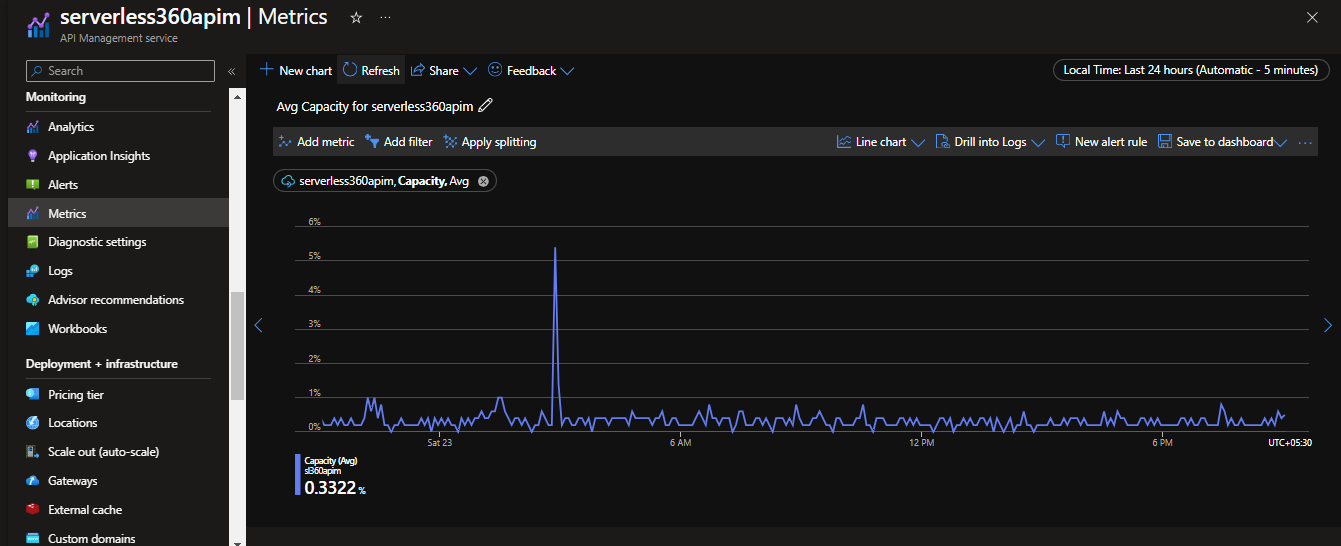
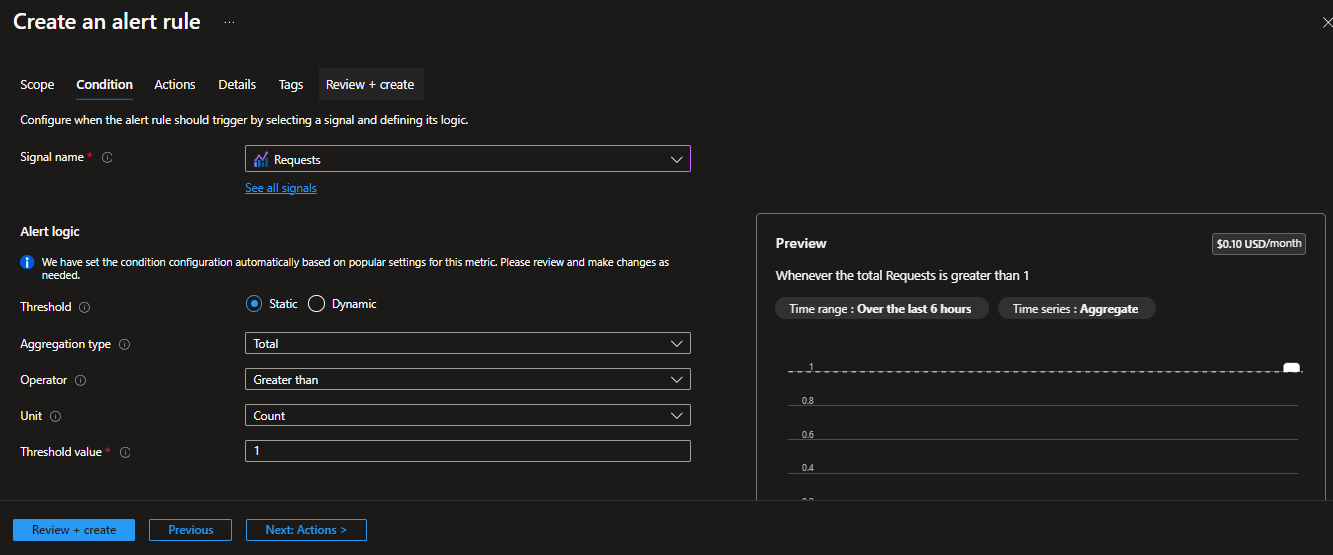
Follow the below steps to set up an alert rule based on a metric:
- Select Alerts from the Monitoring section of the API Management service.
- Click on the Create alert rule button.
- An extensive list of metrics can be found under the signal type Metrics. Select the appropriate metric to be monitored.
- Define the threshold value for the alert rule.
- The alert logic and rule evaluation frequency can be customized as needed.
- To notify the users about the alert, create an action group from the Actions tab, which will send an email notification.
Resource logs
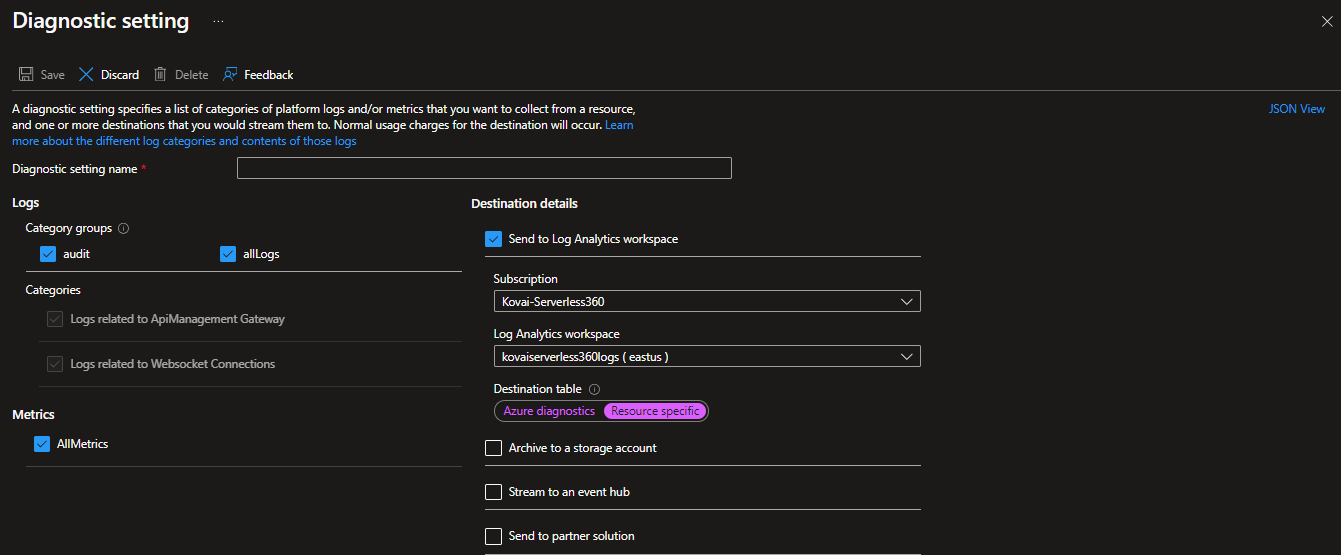
All the operations performed within the resource are collected as resource logs. This log insight varies based on different Azure services. These data are collected when the diagnostic setting is turned on for the API Management service.
Diagnostic settings can be enabled for API Management service as follows:
- Select Diagnostic settings from the Monitoring section of the API Management service.
- Click on + Add diagnostic setting.
- Select the category of data to be collected and the destination to store it. This data can be used to set up alert rules.
These logs can then be used for running Kusto queries, allowing us to conduct more advanced analysis and uncover more profound insights about the resource.
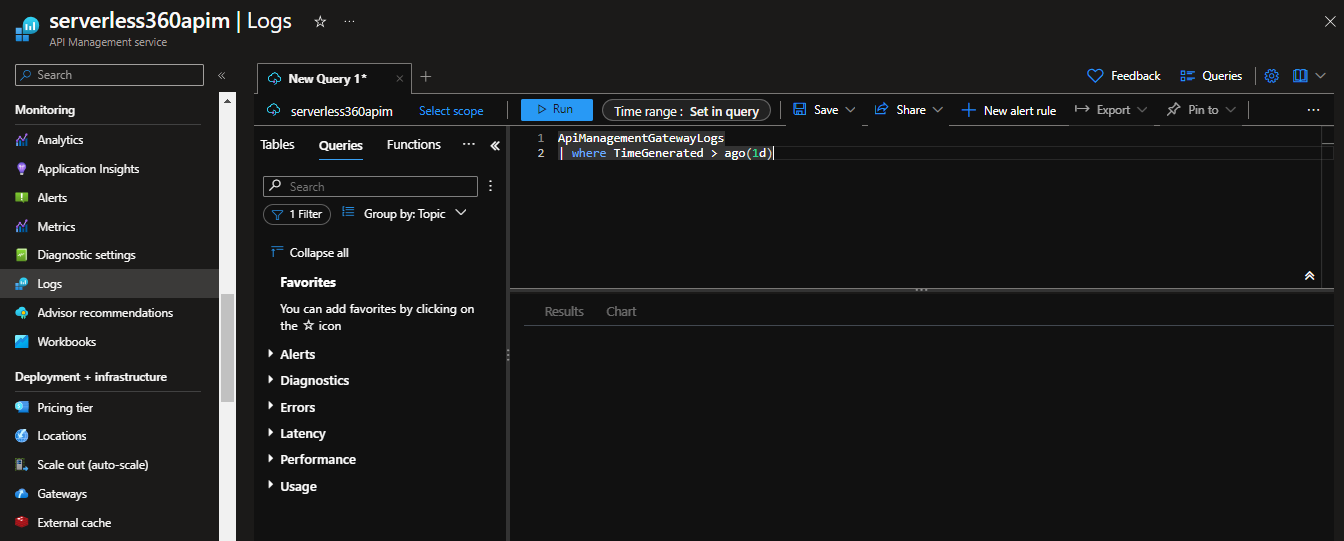
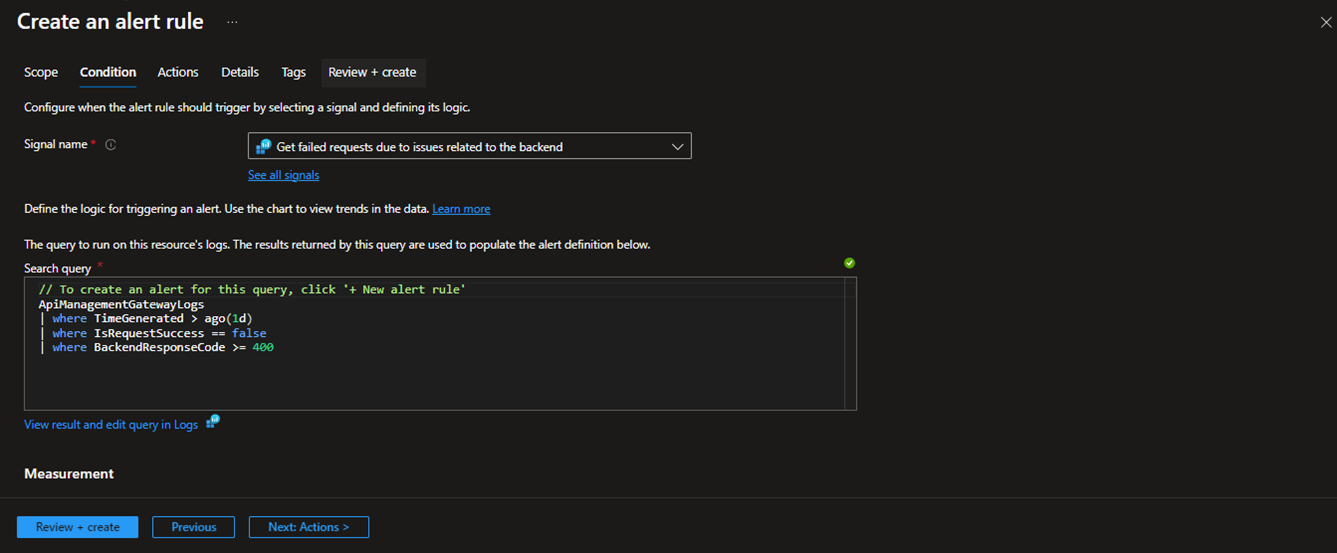
Follow the below steps to set up an alert rule based on the resource log:
- Select Alerts from the Monitoring section of the API Management service.
- Click on the Create alert rule button.
- A predefined log query or a custom query can be added under the Log search signal type.
- The alert logic and rule evaluation frequency can be customized as needed.
Azure API Management monitoring for holistic observability using Turbo360
The Turbo360’s Business Application includes an Azure API Management monitoring tool that helps you monitor and troubleshoot, Azure APIM holistically.
The first step to monitoring the APIM resources is adding them to the Business Application. Resources like API Management service, APIM Product, APIM API, and APIM Operation can be added.
Each added resource type has metrics like failed requests, capacity, average response time, etc. Dashboards can be built based on these metrics. A dashboard can consist of multiple widgets containing relevant data of a business flow belonging to various resources, giving a unified view of the business.
Besides metrics, widgets can also be configured based on the query results. The widget supports charts like lines, bars, donuts, areas, and grids.
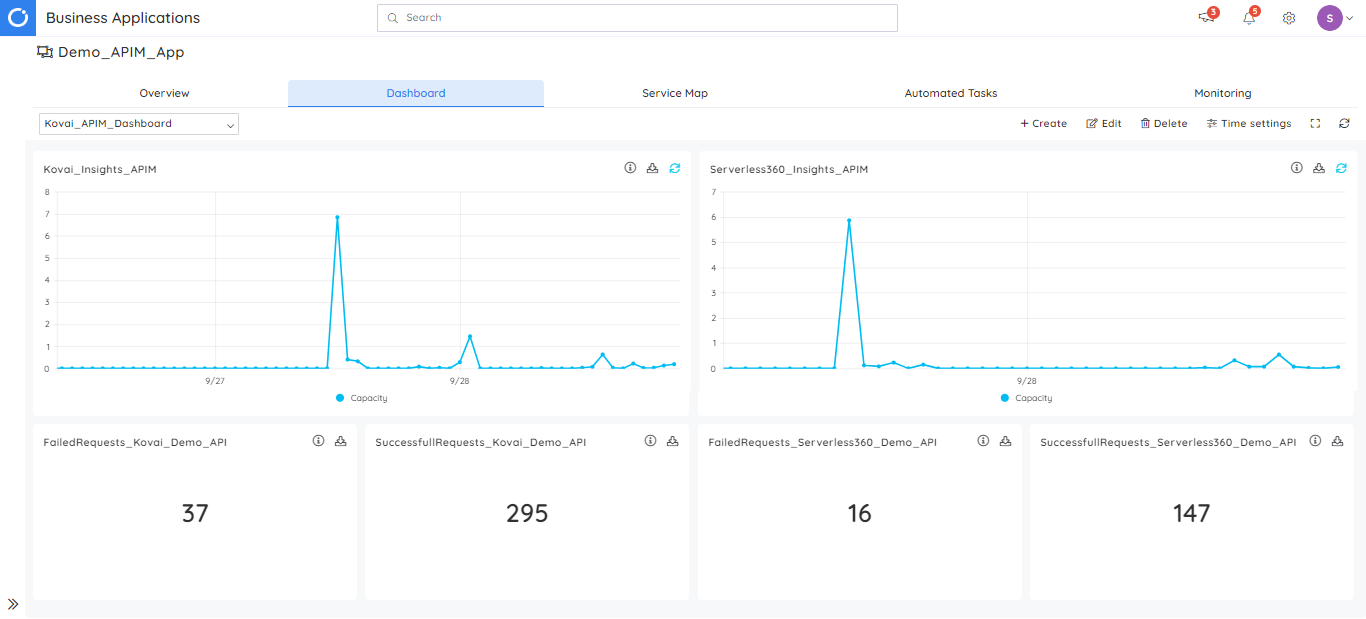
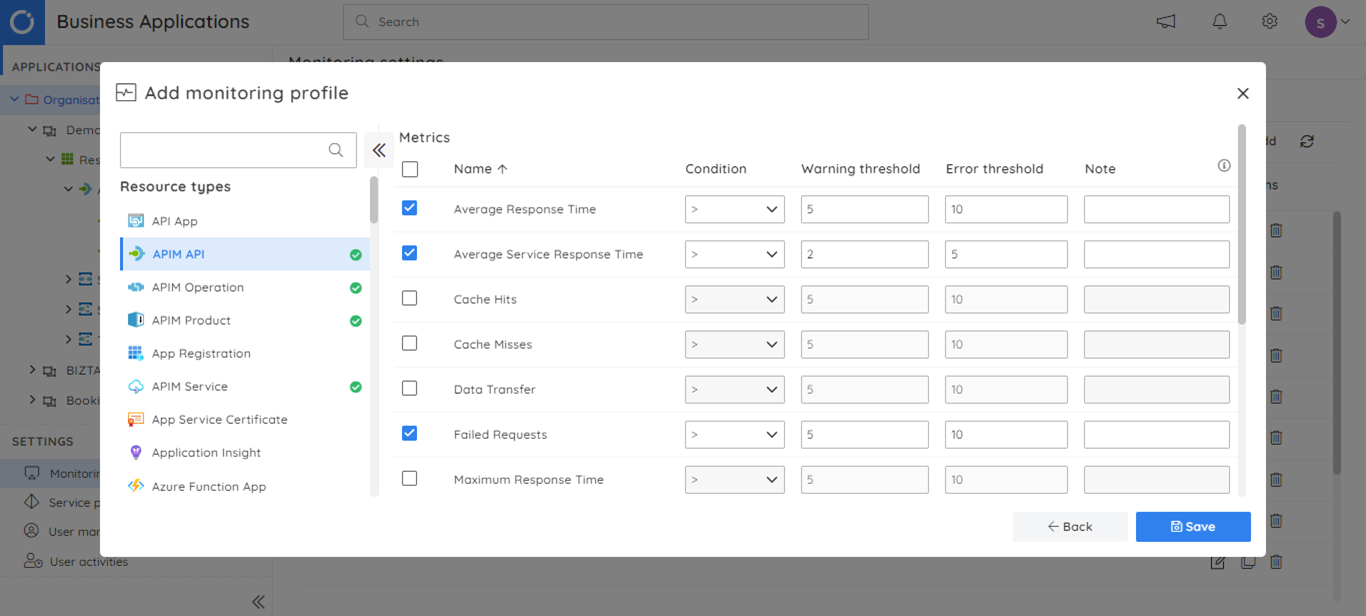
Apart from configuring dashboards using these metrics, monitoring can be configured on these metrics appropriately from the monitoring section of each resource. Additionally, APIM Products can be monitored based on their published state. Moreover, the APIM Product’s state can be automatically updated based on the monitoring result.
Configuring monitoring at the resource level is appropriate when there are few resources, but monitoring profiles come in handy when multiple resources need monitoring. Monitoring profiles make monitoring multiple resources using the same configuration feasible by allowing it to be applied to the Business Application.
Once the resources are added to the Business Application and monitoring is configured, the resources are monitored, and users will be notified of any violations.
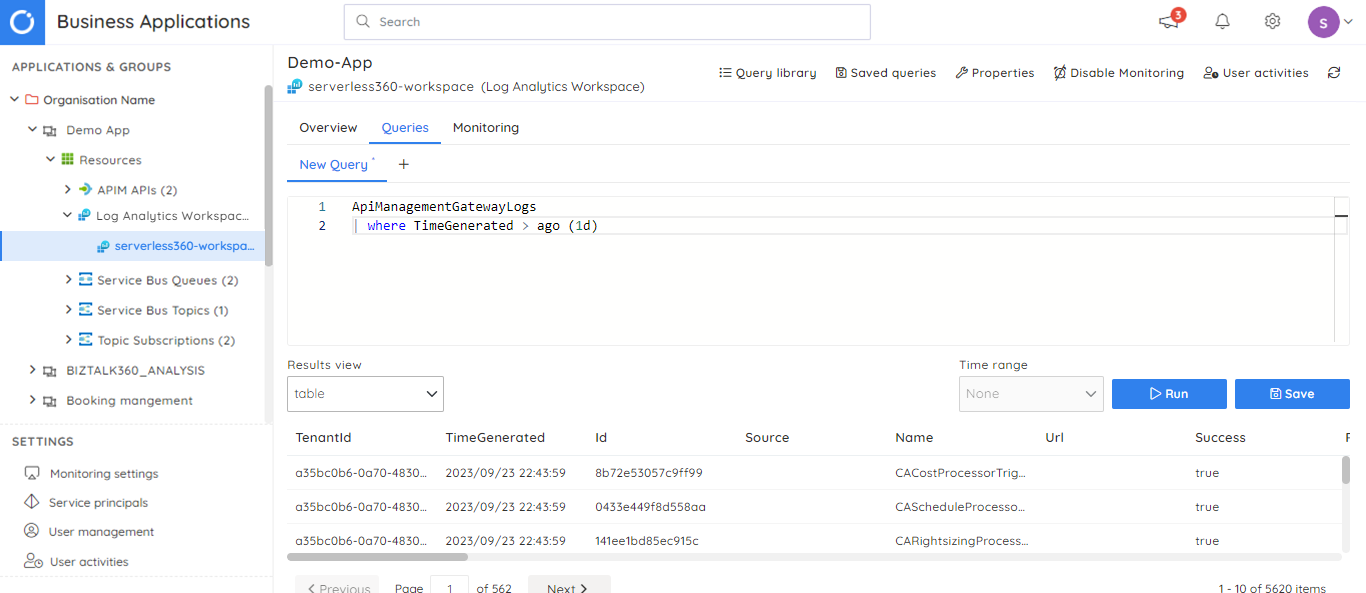
Besides monitoring using the Azure metrics and the resource state, the resource logs can also be used to configure monitoring. Application Insights or Log Analytics workspace configured in the diagnostic settings is used to achieve this. Adding the Log Analytics resource containing the logs in the Business Application, Turbo360, makes it possible to query and monitor APIM service.
On the Log Analytics resource, queries can be run, and the outputs can be displayed in several ways, including tables and charts. In addition to running the queries and viewing the logs, monitoring can be done on them. Scalar and non-scalar queries are both supported by query monitoring.
Alert notifications are configured using escalation policies in Turbo360. Alerts can be configured to be propagated to multiple levels at specific intervals to avoid missing the notification. It can notify one or more users, including notification channels like Teams, Slack, Webhook, etc.
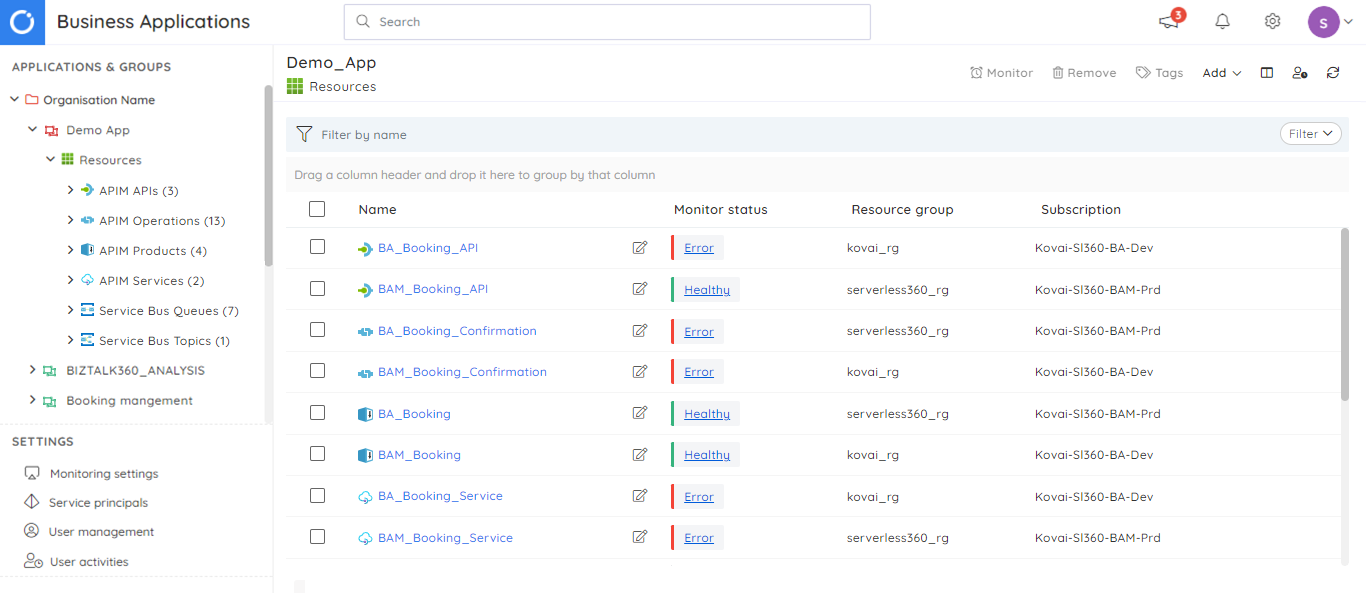
After successfully evaluating monitoring rules configured for each resource, the evaluation status is represented against each resource as Monitor Status. The state of the whole application is determined based on each resource’s monitoring state.
Conclusion
Azure API Management is a robust solution that simplifies building and maintaining APIs. Azure API Management monitoring is essential for maintaining the health and effectiveness of the API ecosystem. Azure enables monitoring of the API Management service through Azure Monitor. Though powerful, configuring monitoring for multiple resources is complex and requires more time.
Turbo360 can be a valuable tool for organizations looking to centralize and streamline their monitoring efforts, especially when managing complex API ecosystems. It provides a robust and unified platform for monitoring and managing various Azure services while maintaining reliability and performance.
 INTEGRATE 2026 | The Largest Microsoft Integration Tech Conference -
