As organizations migrate to the cloud and integrate systems like Dynamics365, Salesforce, and ServiceNow with Azure Integration Services, monitoring becomes crucial for maintaining system performance and keeping costs in check.
This guide compares the top Azure monitoring tools to help you choose the best one for your business.
How to Choose the Right Azure Monitoring Tool for Your Business
Traditional monitoring tools were primarily designed for monolithic applications and struggle with the complexity of modern Azure environments. The dynamic, interconnected nature of distributed Azure applications demands monitoring solutions that can:
- Adapt to rapid changes;
- Scale across multiple services;
- And provide unified visibility into complex dependencies.
When evaluating Azure monitoring tools for your organization, consider these key capabilities organized by priority:
- Small Organizations (10-50 resources): Focus on Core Monitoring Capabilities and Native Azure Integration
- Medium Organizations (50-500 resources): Balance Core Monitoring with Integration and Data Management features
- Large Enterprises (500+ resources): Prioritize all categories, with special emphasis on Governance and Compliance
| Category | Capability | What to Look For | Priority Level |
| Core Monitoring Capabilities | Cross-Environment Visibility |
|
High |
| Dependency Mapping and Topology |
|
High | |
| Performance and Availability Monitoring |
|
High | |
| Integration and Data Management | Native Azure Integration |
|
High |
| Third-Party Tool Compatibility |
|
Medium | |
| Notification and Communication |
|
Medium | |
| Proactive Operations and Automation | Early Issue Detection |
|
Medium |
| Automated Response Capabilities |
|
Medium | |
| Governance and Compliance | Audit and Security |
|
High (Enterprise) |
| Cost Management Integration |
|
Medium | |
| Evaluation and Implementation | Trial and Testing Options |
|
Low |
| Scalability and Pricing Models |
|
High |
Bottom Line: SMBs should prioritize tools that offer strong native Azure integration and automation capabilities, while enterprises should focus on comprehensive governance features and advanced analytics. Regardless of size, ensure any solution provides hands-on evaluation before making a long-term commitment.
Pricing Guidance & Cost Considerations
Understanding the different pricing models for Azure monitoring tools is crucial for making a cost-effective decision.
Here’s a breakdown of common pricing approaches and approximate cost ranges:
Pricing Models Explained
Per-Host/Resource Pricing
These tools charge based on the number of monitored resources (VMs, containers, services).
Typical range: $5-25 per host/month.
- Examples: Datadog ($15+/host), Site24x7 ($10+/host), Opsview ($8-13/host)
- Best for: Organizations with predictable infrastructure size
- Watch out for: Costs can escalate quickly with auto-scaling environments
Data Ingestion Pricing
These tools charge based on the volume of monitoring data collected and stored.
Typical range: $0.10-2.50 per GB ingested.
- Examples: New Relic ($0.25/GB), Splunk (variable), Logz.io (tiered)
- Best for: Organizations with variable monitoring needs
- Watch out for: Log-heavy applications can generate unexpected costs
User-Based Pricing
In this model, pricing scales with the number of users accessing the monitoring platform.
Typical range: $20-100+ per user/month.
- Examples: Many enterprise tools offer this model
- Best for: Large teams needing broad access
- Watch out for: Can become expensive for organizations wanting wide visibility
Freemium/Free Tier Options
Many tools offer significant free tiers that can support small to medium deployments:
- Azure Monitor: Built into Azure subscriptions, pay for data retention beyond basic limits
- Grafana: Open source, free to use (hosting costs apply)
- New Relic: 100GB/month free data ingestion
- Datadog: Free tier for up to 5 hosts
- Better Stack: 10 monitors, 3GB logs, 2 billion metrics free
Budget Planning Guidelines
| Organization Size | Resource Count | Monthly Budget | Key Focus Areas |
| Small Organizations | 10-50 resources | $200-1,000/month | Tools with generous free tiers or simple per-host pricing |
| Medium Organizations | 50-500 resources | $1,000-10,000/month | Balance between features and cost, evaluate data ingestion models |
| Large Organizations | 500+ resources | $10,000+/month | Enterprise features, compliance, and total cost of ownership |
5 Common Azure Monitoring Challenges
Understanding these key challenges can help you select the right tools and strategies that will help solve your specific pain points:
1. Multi-Subscription Visibility
Challenge: Large organizations struggle to get unified monitoring across dozens of Azure subscriptions and tenants.
Solution: Choose tools like Turbo360, Datadog, or Dynatrace with native multi-subscription support, or implement Azure Lighthouse for centralized management.
2. Alert Fatigue
Challenge: Too many alerts lead to teams ignoring notifications and missing critical issues.
Solution: Prioritize tools with intelligent alerting and ML-based anomaly detection (Dynatrace AI, Azure Monitor smart detection) and establish clear alert severity levels.
3. Complex Dependency Mapping
Challenge: Modern Azure applications have intricate dependencies that make root cause analysis difficult.
Solution: Implement application-level monitoring tools (Turbo360, Application Insights, Dynatrace) that provide dependency visualization and distributed tracing.
4. Cost Attribution
Challenge: Understanding which teams, applications, or customers drive Azure spending without proper monitoring attribution.
Solution: Use specialized cost monitoring tools (Turbo360) or implement comprehensive tagging strategies with cost-aware monitoring platforms.
5. Tool Integration Complexity
Challenge: Multiple monitoring tools create data silos and operational overhead.
Solution: Choose one comprehensive platform or pick tools with strong API integration capabilities to create unified dashboards.
Key Takeaways
- Start with your biggest pain point when evaluating tools
- Consider tools that address multiple challenges to reduce complexity
- Establish monitoring governance early to prevent issues from scaling
- Plan for growth — challenges often intensify as your Azure footprint expands
What Are the Top 5 Azure Monitoring Tools Right Now?
The difference between a good and great Azure monitoring strategy often comes down to choosing the right tool. Whether you need consolidated alerting across complex integrations, AI-powered root cause analysis, or unified visibility across multi-cloud environments, there’s a solution designed for your specific use case.
Here’s how the top monitoring platforms stack up against real-world Azure challenges.
| Tool | Key Strengths | Key Limitations | Pricing Model | Best For |
| Turbo360 |
|
|
|
Complex Azure integrations Application-level monitoring Organizations wanting unified Azure visibility |
| Azure Monitor |
|
|
|
Native Azure monitoring Organizations already deep in Azure ecosystem Basic infrastructure monitoring |
| Dynatrace |
|
|
|
Multi-cloud environments AI-driven analysis needs Web application monitoring Enterprises needing advanced analytics |
| Datadog |
|
|
|
Unified monitoring across entire stack Teams needing multiple monitoring capabilities Cloud-native applications |
| New Relic |
|
|
|
Real-time application monitoring Performance-focused monitoring Organizations with variable monitoring needs |
1. Turbo360
Turbo360 is one of the top-rated Azure monitoring tools for complex integrations built on Azure.
The platform offers end-to-end visibility, unified Azure Monitoring from an application context and includes features such as event triggers, alerting, and diagnostics. As an advantage, you can auto-document your entire Azure Infrastructure and have complete control over the cost using Turbo360.
It also supports enabling role-based access control and governance, making it ideal for enterprise-level deployments.
How does Turbo360 differ from native-Azure monitoring tools?
- Holistic view: Visualize the Azure services across tenants and subscriptions from an application context.
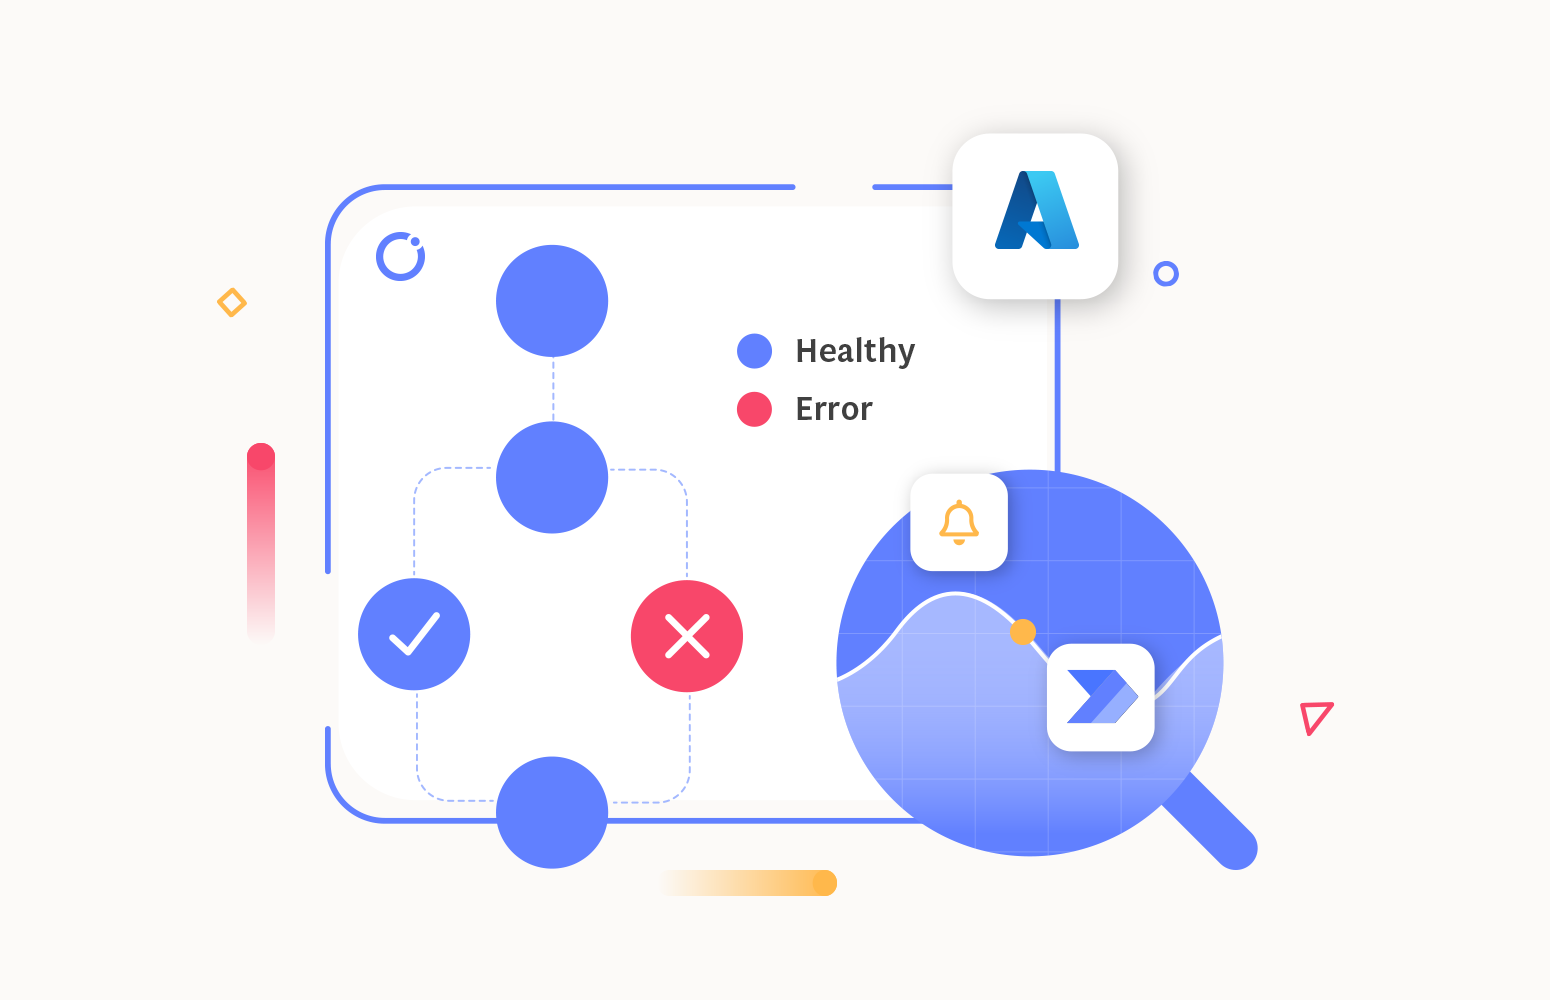
- Consolidated error reporting: It avoids sending multiple alerts for siloed services and instead generates and sends one consolidated report.
- Azure resource dependency mapping: Real-time visualization of dependencies between Azure services in an application.
- End-to-end visibility: Track how the message/request flows across your Azure/hybrid integrations.
- Root-cause analysis: Get to the bottom of any critical failures with no dependency on Azure experts and proactively resolve issues before they impact your users.
- Pre-defined monitoring templates: Set up Azure monitoring on multiple metrics within minutes and get alerted on threshold violations.
- Detect issues faster: Customizable dashboards with actionable insights and KPIs to pinpoint any deviation in the application performance.
- Enhanced security: It supports integrating with Azure Active Directory and offers advanced security features such as access control and threat detection.
- Avoid juggling between multiple tools: It simplifies the management of Azure applications by providing a single platform to monitor, track and troubleshoot critical failures.
- Automation: Turbo360 offers an advanced operational toolset to automate mundane tasks.
Cons
- It is primarily designed to work with Azure services and may not provide comprehensive integration with non-Azure services.
- Has a steep learning curve for beginners.
Get hands-on experience with a 15-day free trial.
2. Azure Monitor
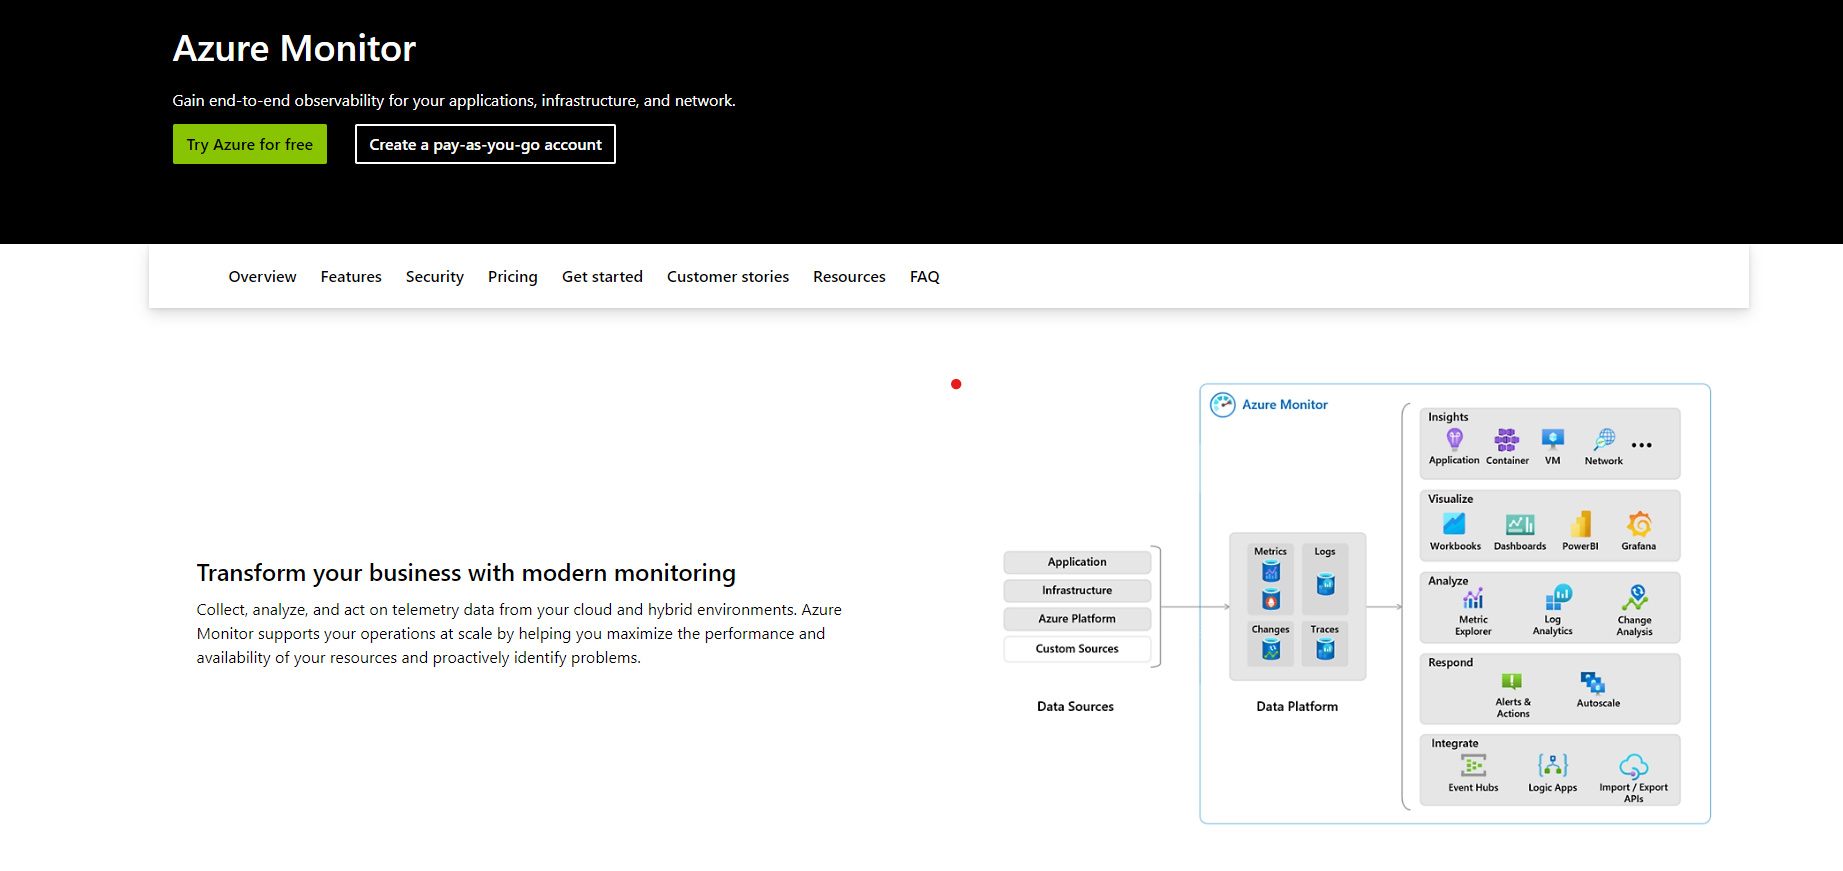
It is a comprehensive Azure monitoring tool for the Azure cloud platform. It provides a unified view of your application and infrastructure health, with features such as log analytics, metrics, and alerts.
Azure Monitor also integrates with other Azure services, including Azure Functions and Azure App Service, allowing for deeper insights and analysis. Get to know the pros and cons of Azure Monitor.
Pros
- Easily accessible: Azure Monitor is built into the Azure portal, eliminating the need to use a different third-party tool for monitoring.
- Alerting: It allows you to set up alerts based on specific metrics and conditions.
- Monitoring multiple services: Azure Monitor supports monitoring various Azure resources and services, including virtual machines, databases, and applications.
- Scalability: Azure Monitor is scalable, allowing you to monitor large-scale environments easily.
Cons
- Siloed monitoring on Azure resources: You will have to set up monitoring alerting for every resource involved in your application (No application-level monitoring).
- Hard to attain message tracking: Requires a lot of instrumentation to partially attain end-to-end message tracking using App Insights.
- Complexity: Azure Monitor can be complex and challenging to configure, especially for users new to Azure or cloud monitoring in general.
- Cost: Azure Monitor can be expensive, especially if you monitor many resources or generate a high volume of data.
- Limited monitoring of non-Azure resources: Azure Monitor is primarily designed for monitoring Azure resources and may not provide comprehensive monitoring for non-Azure resources.
- Limited functionality for some resources: Azure Monitor may not provide all the functionality you need to monitor some resources, which may require you to use additional tools or services.
Deciding between Azure Monitor and Turbo360? Check out our comparison: Azure Monitor vs Turbo360
3. Dynatrace
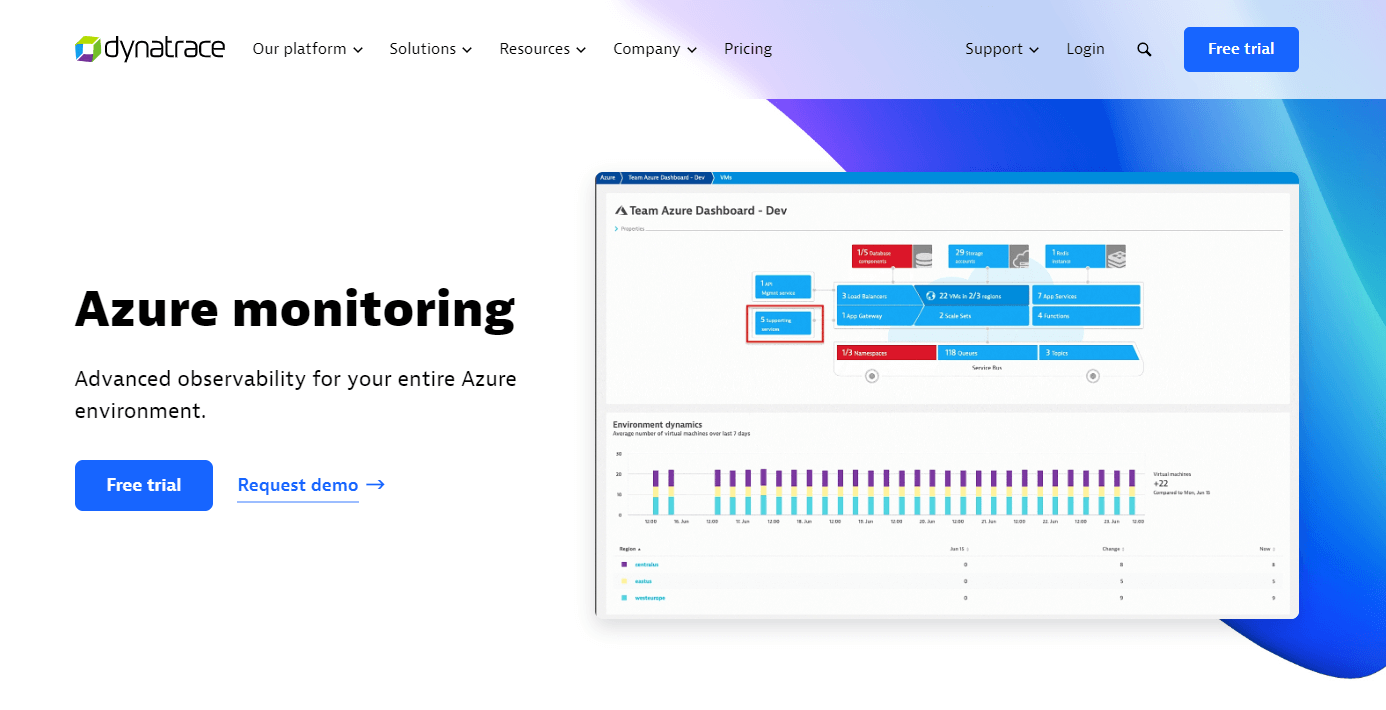
Dynatrace is a cloud monitoring and management tool that provides real-time insights into your applications and infrastructure.
It offers a range of features, including application performance monitoring (APM), infrastructure monitoring, and user experience monitoring. Dynatrace also provides AI-powered root cause analysis, which can help to identify and resolve issues.
Pros
- Multi-cloud environments: It provides real-time insights into the performance of applications built on top of multi-cloud services.
- Root cause analysis: It uses Artificial Intelligence (AI) and Machine Learning (ML) to automatically detect and analyze issues.
- Reporting dashboards: Easy-to-use custom dashboards to visualize business-critical data.
- Integration with other tools: It integrates with a wide range of different tools and services, such as Jenkins, Git, and AWS, which makes it easier to incorporate them into your existing workflows.
Cons
- Expensive with high volumes of data: Dynatrace can be expensive, especially if you monitor many applications or generate a high volume of data.
- Limited customization: Dynatrace may not provide all the customization options you need to tailor it to your specific application requirements.
- Limited monitoring of non-web applications: Dynatrace is primarily designed for monitoring web applications and may not provide comprehensive monitoring for non-web applications.
To gain a more profound perspective, evaluate Dynatrace vs Turbo360.
4. Datadog
Datadog is a cloud monitoring and analytics platform that offers real-time monitoring and insights across your entire stack. It offers customizable dashboards and alerts, making it ideal for teams who need to stay on top of their applications and infrastructure.
Pros
- Unified platform: Datadog offers a unified platform that can handle infrastructure monitoring, application performance monitoring, log management, security monitoring, network monitoring, synthetic monitoring, and real user monitoring.
- Extensive integration: Datadog supports integrating with various cloud services and tools.
- Ease of deployment: Datadog has a simple and fast installation and configuration process.
- Scalability: Datadog like Dynatrace is highly scalable and can easily monitor large-scale environments.
Cons
- Complexity: Datadog can be complex and challenging to configure, especially for users who are new to cloud monitoring or have not before used similar tools.
- Expensive: Datadog can be expensive for log analytics and data retention.
- Limited monitoring of non-cloud resources: Datadog is primarily designed for monitoring cloud resources and may not provide comprehensive monitoring for non-cloud resources.
5. New Relic
Pros
- Real-time monitoring: It supports continuous monitoring of your Azure applications to avoid unexpected performance issues.
- Customizable dashboards: New Relic allows you to create customizable dashboards that display the metrics and data that are most important to you.
- Integration with other tools: New Relic integrates with a wide range of different tools and services, such as AWS, Kubernetes, and Docker, which makes it easier to incorporate them into your existing workflows.
- Scalability: Like Datadog and Dynatrace, New Relic is highly scalable and can easily monitor large-scale environments.
Cons
- High complexity: New Relic can be complex and challenging to configure, especially for users new to cloud monitoring or who have not before used similar tools.
- Compatibility: It can have compatibility issues with some frameworks and languages.
- Limited customization: It may not provide all the customization options you need to tailor it to your specific application requirements.
Everything Else: Additional Azure Monitoring Tools to Consider
Beyond the top 5, there are various other Azure monitoring tools that may fit your specific use case, budget, or monitoring requirements.
Here’s an overview of additional options (organized by category):
Cost & Financial Monitoring
CloudZero
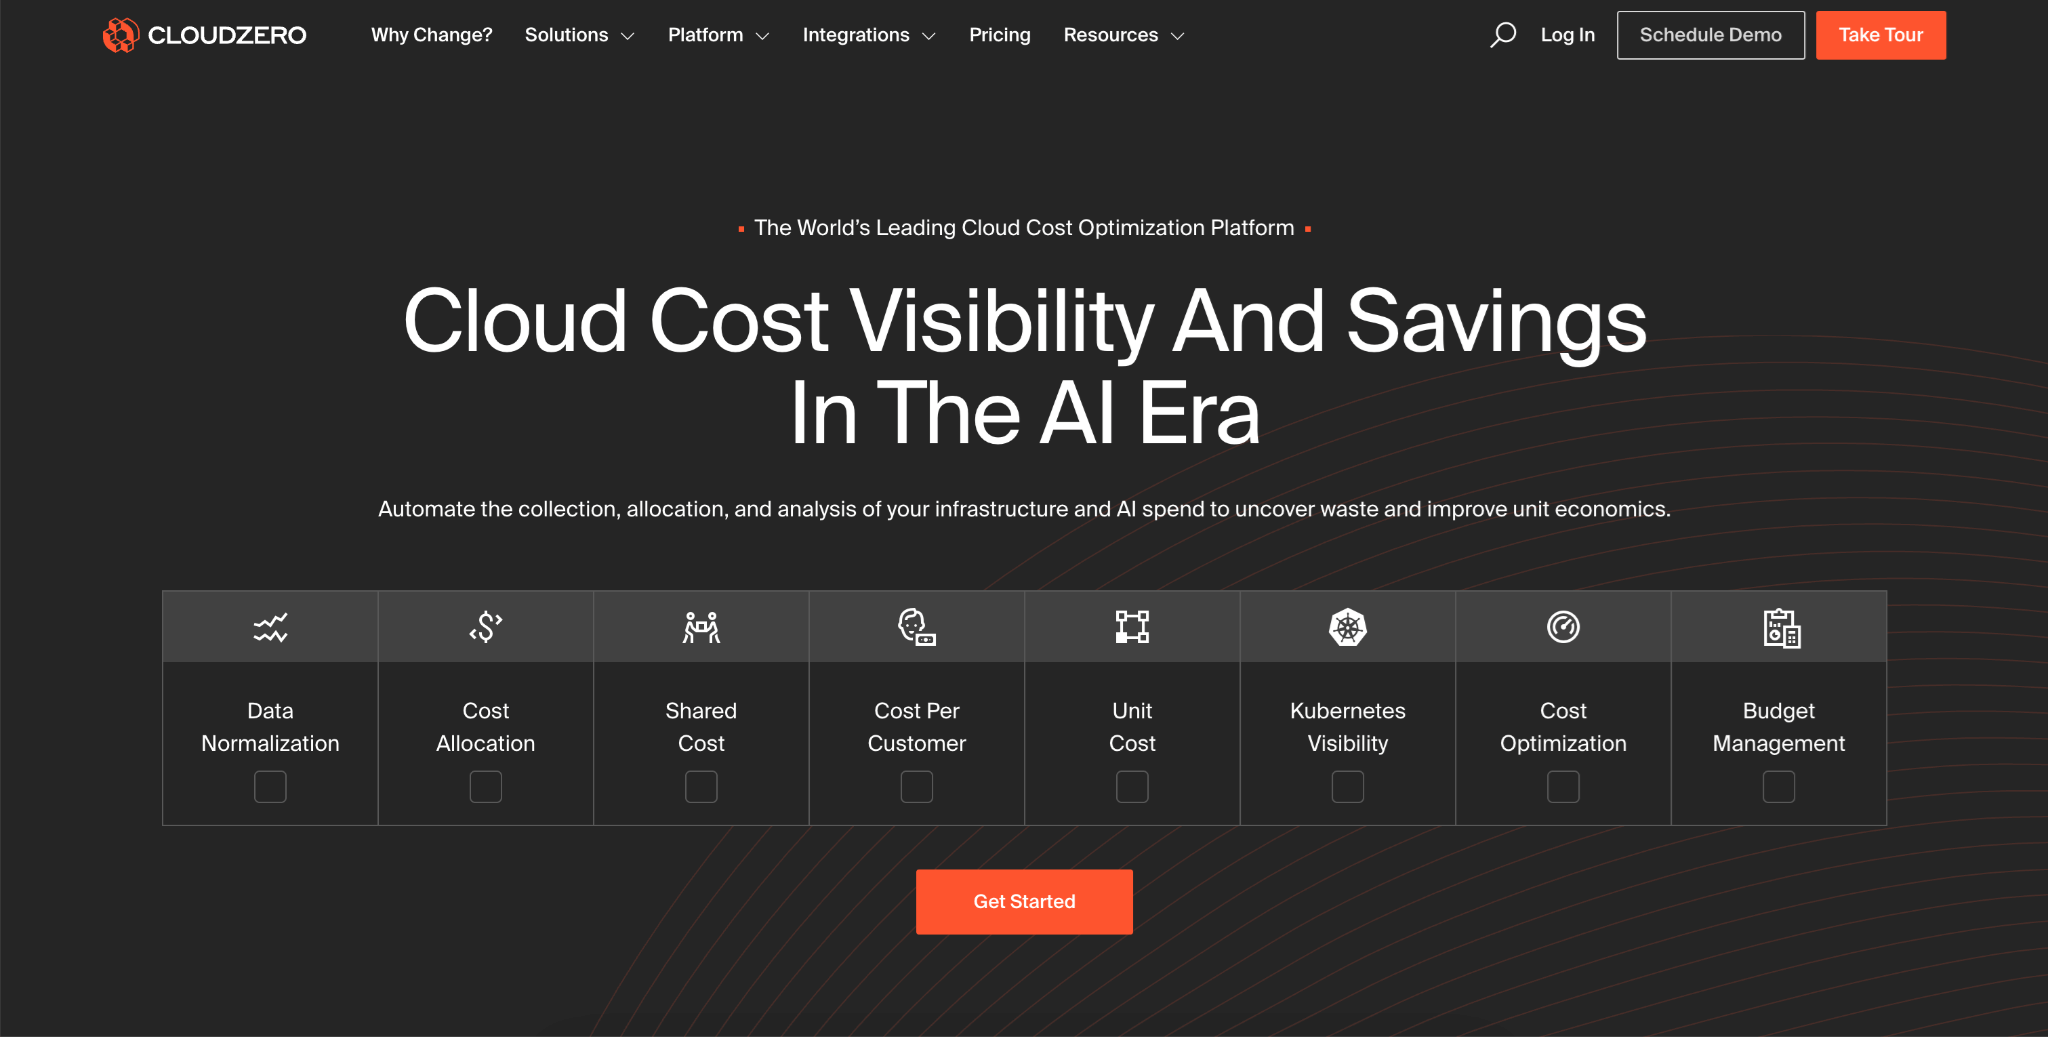
CloudZero is a cloud cost optimization platform that helps organizations understand their Azure spending at a granular level. CloudZero shows cost per customer, feature, or team without requiring extensive tagging, making it ideal for businesses focused on optimizing their cloud economics and understanding true unit costs.
Microsoft Native & Security Tools
Microsoft Sentinel (Azure Sentinel)
Microsoft Sentinel is Azure’s native Security Information and Event Management (SIEM) and Security Orchestration Automated Response (SOAR) solution. Sentinel aggregates security data from various sources including Azure, on-premises systems, and third-party applications, using AI and machine learning to enhance threat detection and automate incident response.
System Center Operations Manager (SCOM) Managed Instance
SCOM is Microsoft’s solution for migrating traditional on-premises SCOM deployments to Azure. This fully managed platform-as-a-service offering combines the latest SCOM capabilities with Azure’s scalability, making it ideal for enterprises transitioning their monitoring infrastructure to the cloud.
Enterprise-Grade Platforms
Splunk Observability
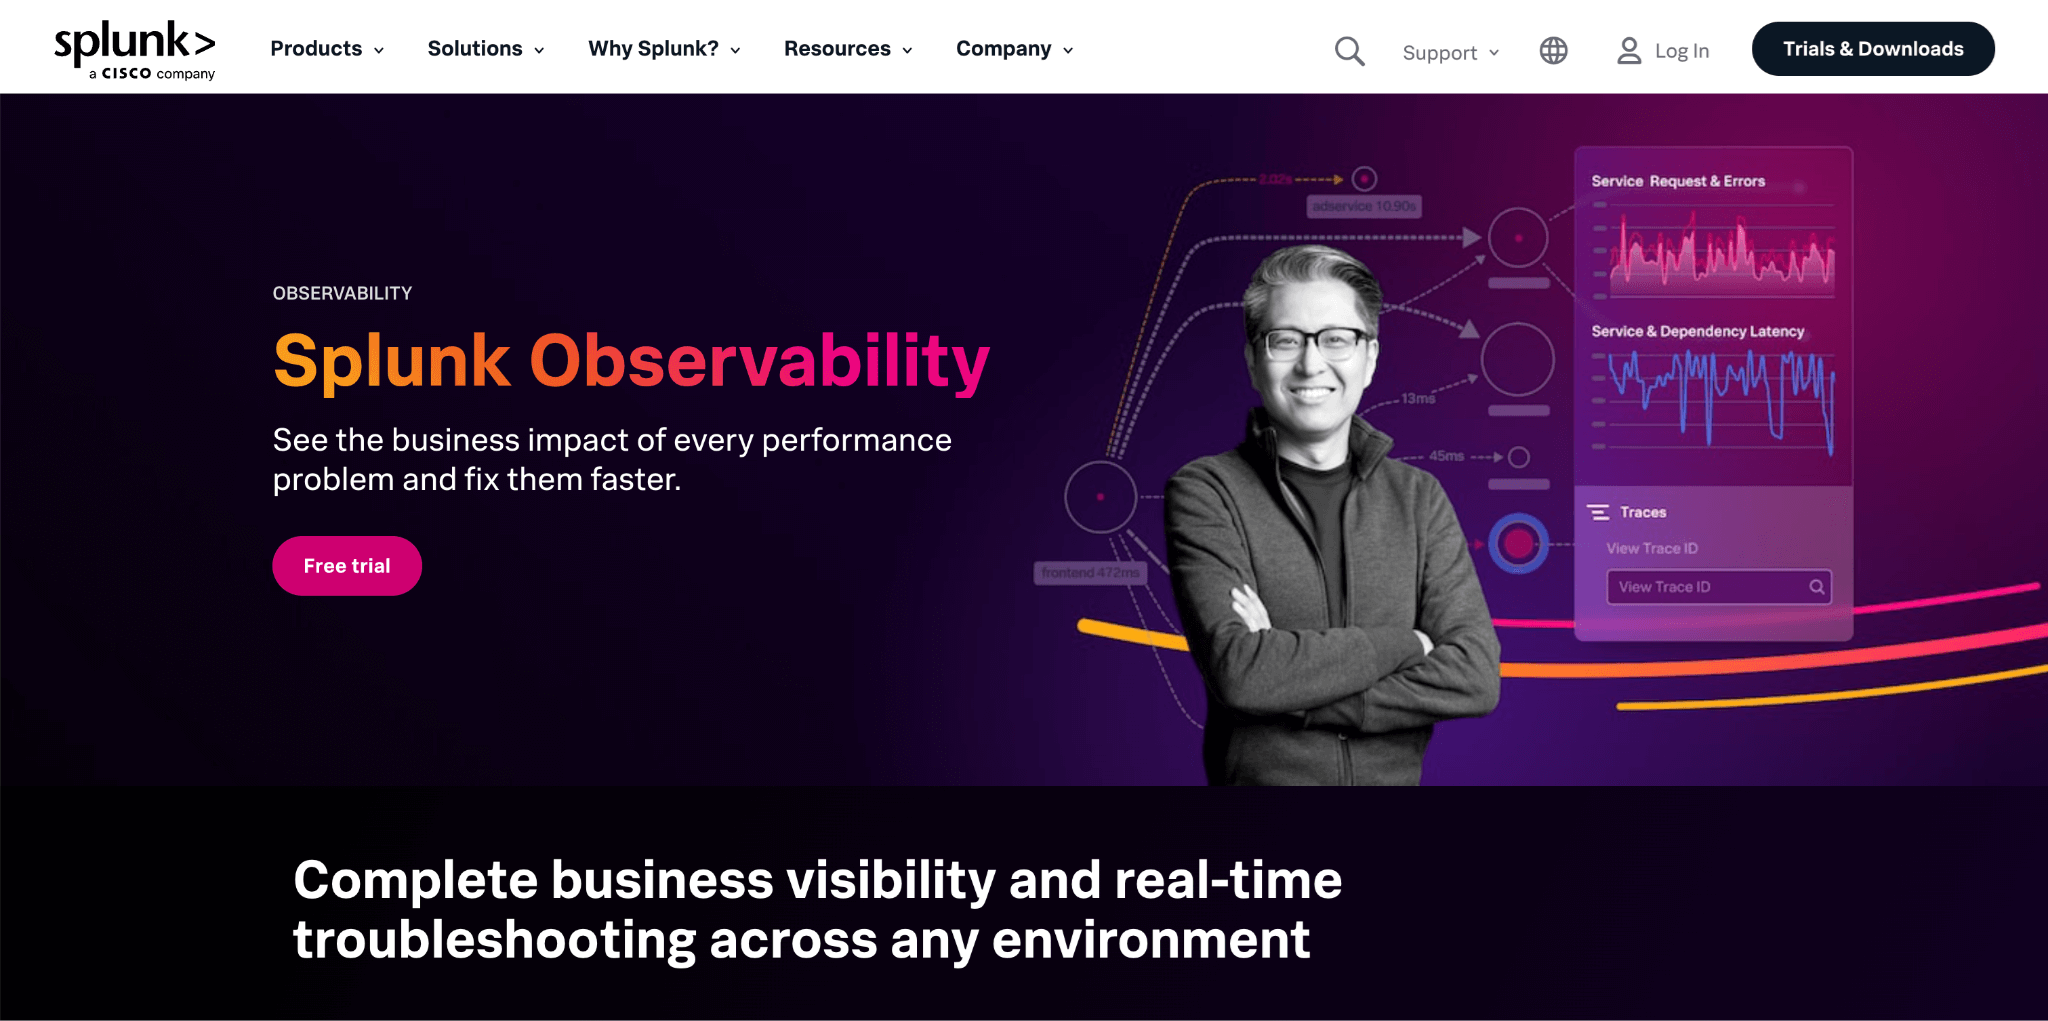
Splunk provides real-time visibility into Microsoft Azure hybrid cloud environments with contextual insights across infrastructure, applications, and customer experience. Splunk unifies data from multiple cloud providers in a single interface, making it ideal for complex multi-cloud deployments.
SolarWinds AppOptics
AppOptics offers application performance monitoring with features like root cause analysis, live code profiling, and transaction tracing. The platform provides both server and application monitoring capabilities, making it a solid choice for organizations needing comprehensive monitoring across Azure and other environments.
Sumo Logic

Sumo Logic is a cloud-native log management and analytics platform with strong security and compliance capabilities. Sumo Logic provides real-time insights into Azure applications and infrastructure through advanced analytics, machine learning, and automated threat detection, making it particularly valuable for enterprises with strict compliance requirements.
Infrastructure & Performance Monitoring
Sematext
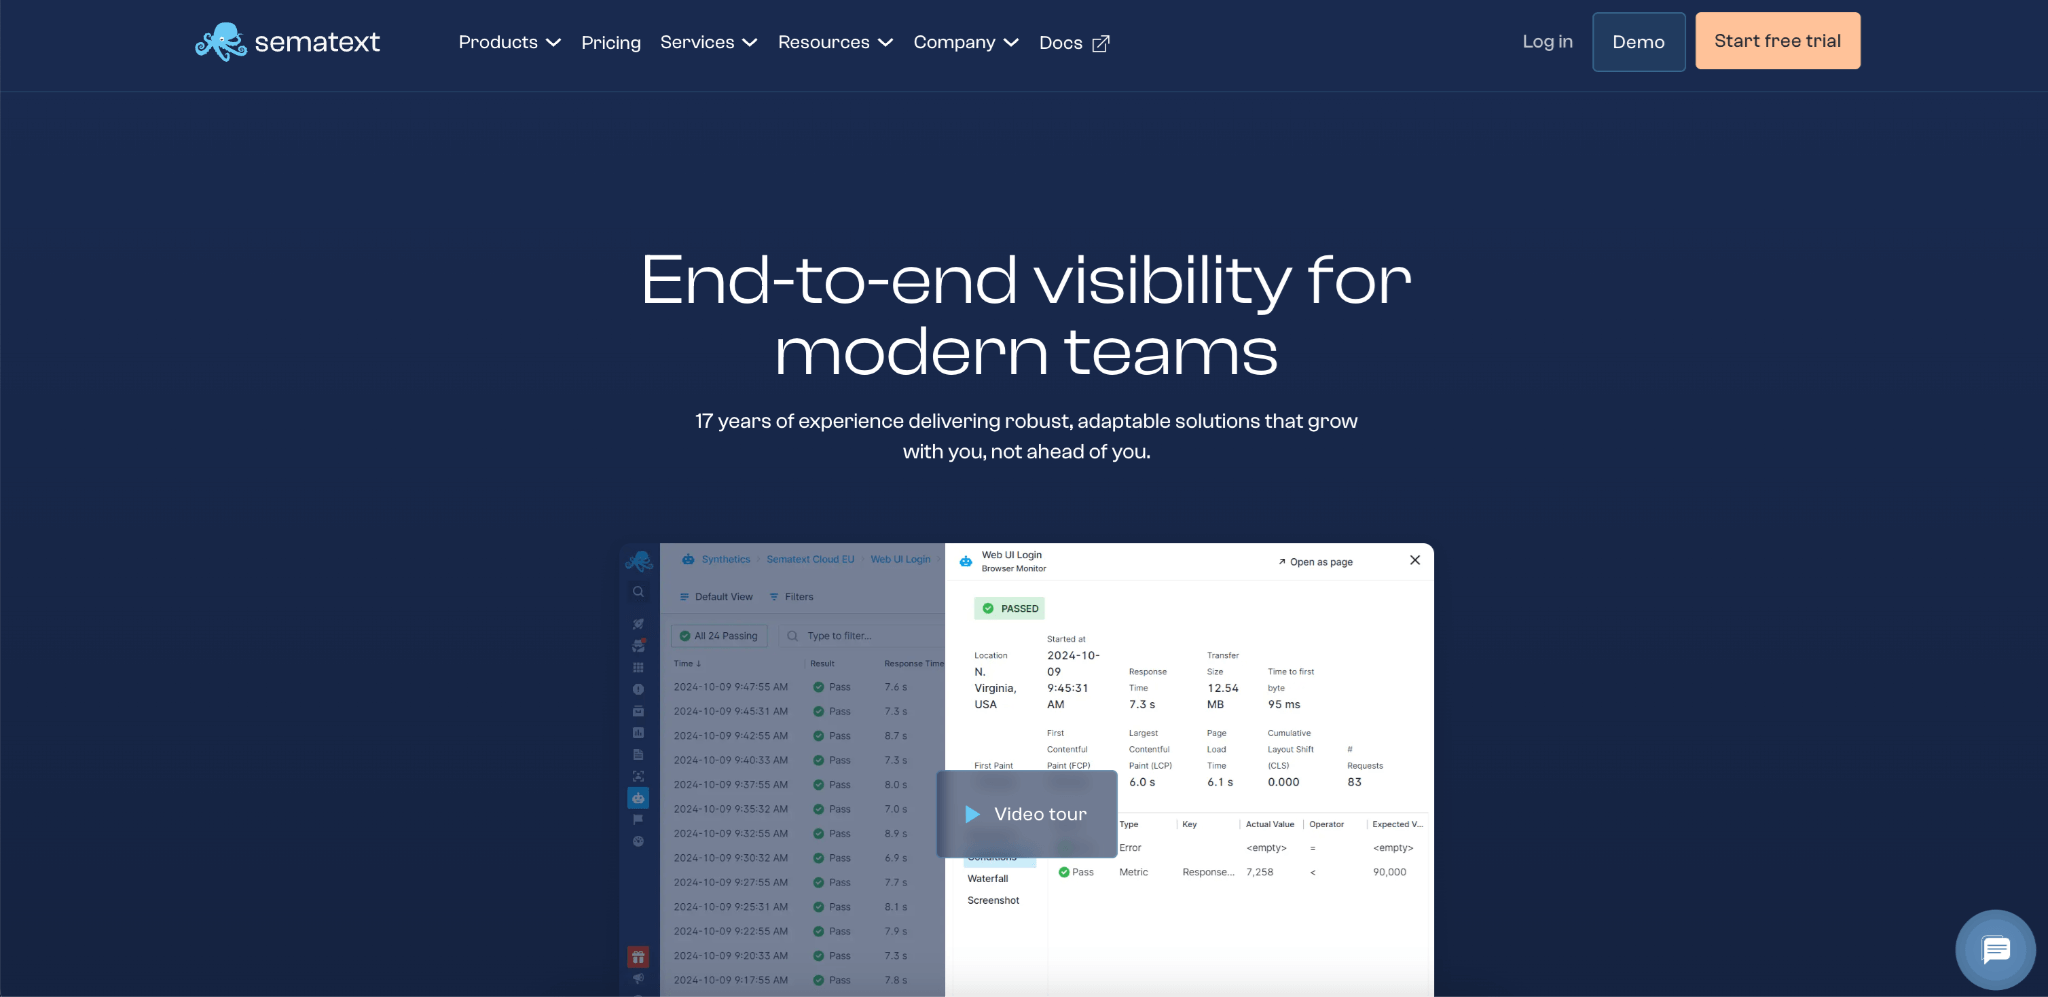
Sematext is a real-time monitoring platform for Azure metrics, events, and logs that works across enterprise environments. Once installed, it monitors multiple Linux infrastructure metrics, including CPU, disk utilization, memory, and provides dashboard templates and alert management features.
Paessler PRTG
Paessler PRTG is an all-in-one Azure monitoring tool that tracks Azure VM status and reports CPU utilization. It connects to Azure management environments using REST API and provides mobile monitoring capabilities for on-the-go management.
Site24X7
Size24X7 is an AI-powered monitoring service that covers over 100 Azure cloud services and resources. It offers performance forecasting using historical data and machine learning models, making it valuable for capacity planning and predictive analytics.
LogicMonitor
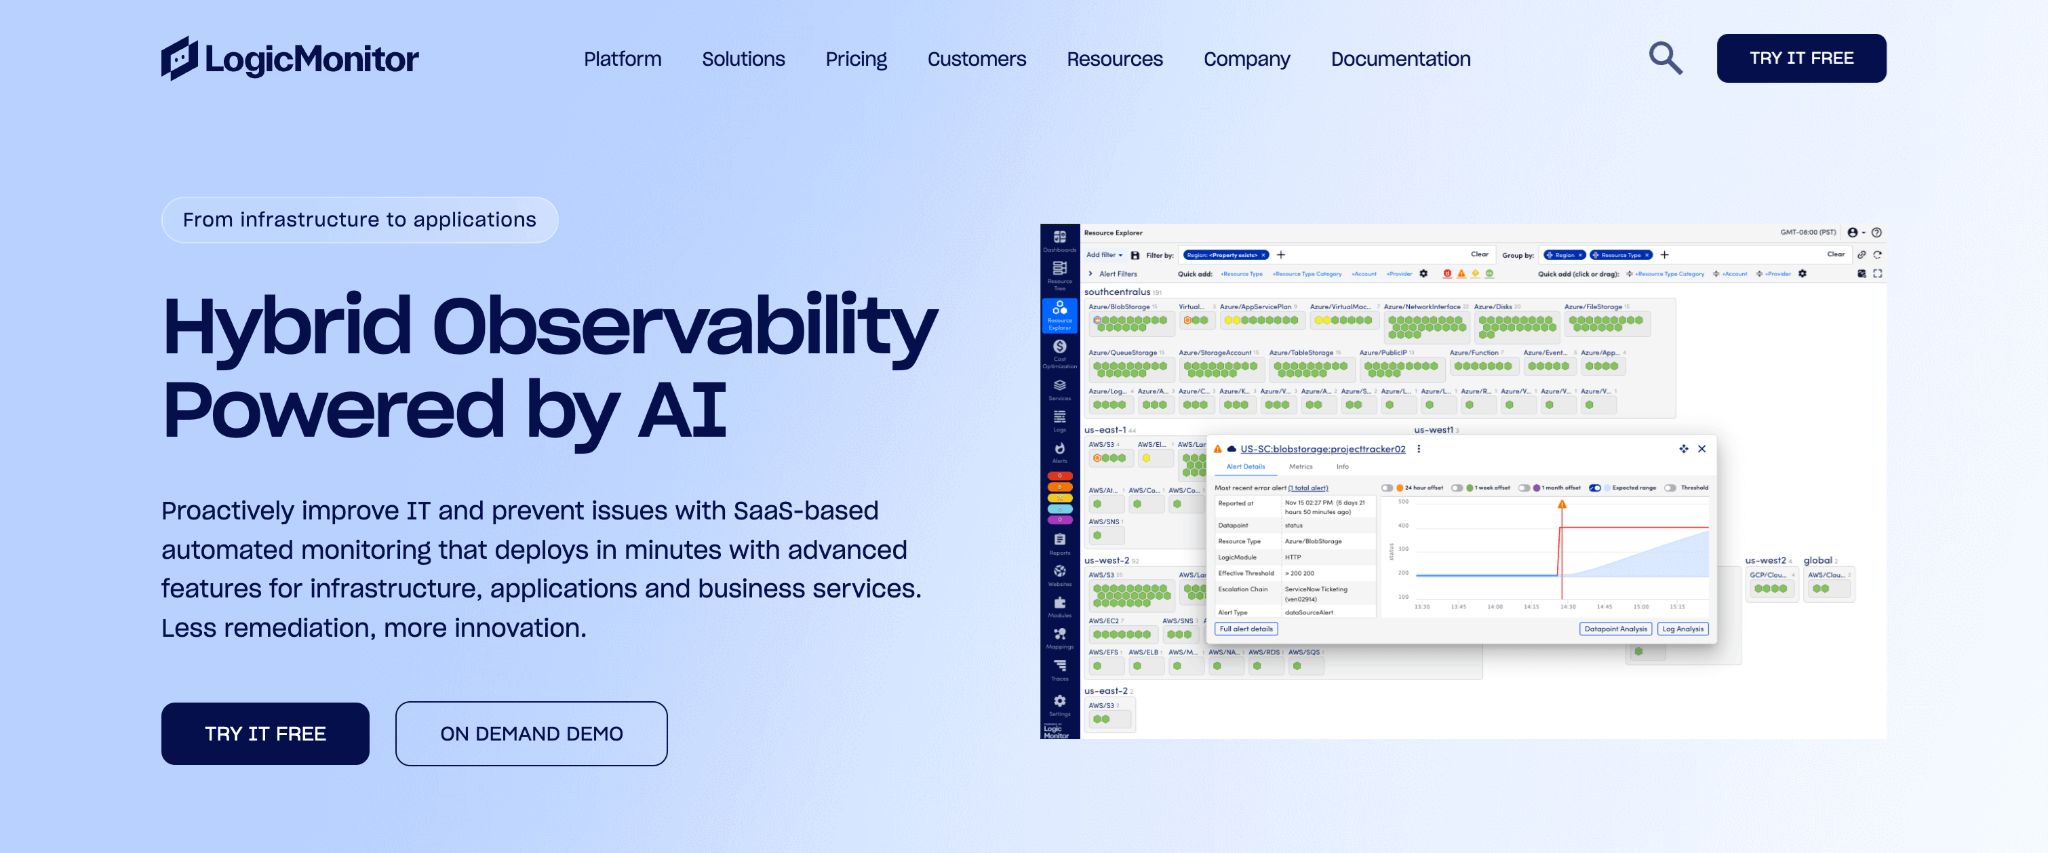
LogicMonitor supports comprehensive Azure metrics monitoring with custom dashboards for visualizing IT operations data. Its Service Limits Utilization feature alerts you when approaching Azure limits, helping ensure infrastructure remains highly available.
eG Innovations
eG Innovations provides Azure cloud, on-premises, and hybrid IT infrastructure monitoring with complete visibility across all IT layers. The platform reveals deep availability metrics, performance insights, and resource utilization patterns with historical analysis capabilities.
ManageEngine
ManageEngine offers agentless Azure monitoring using Azure APIs without requiring collectors or agents. The platform supports real-time and historical analyses, including cloud resource utilization optimization.
Opsview
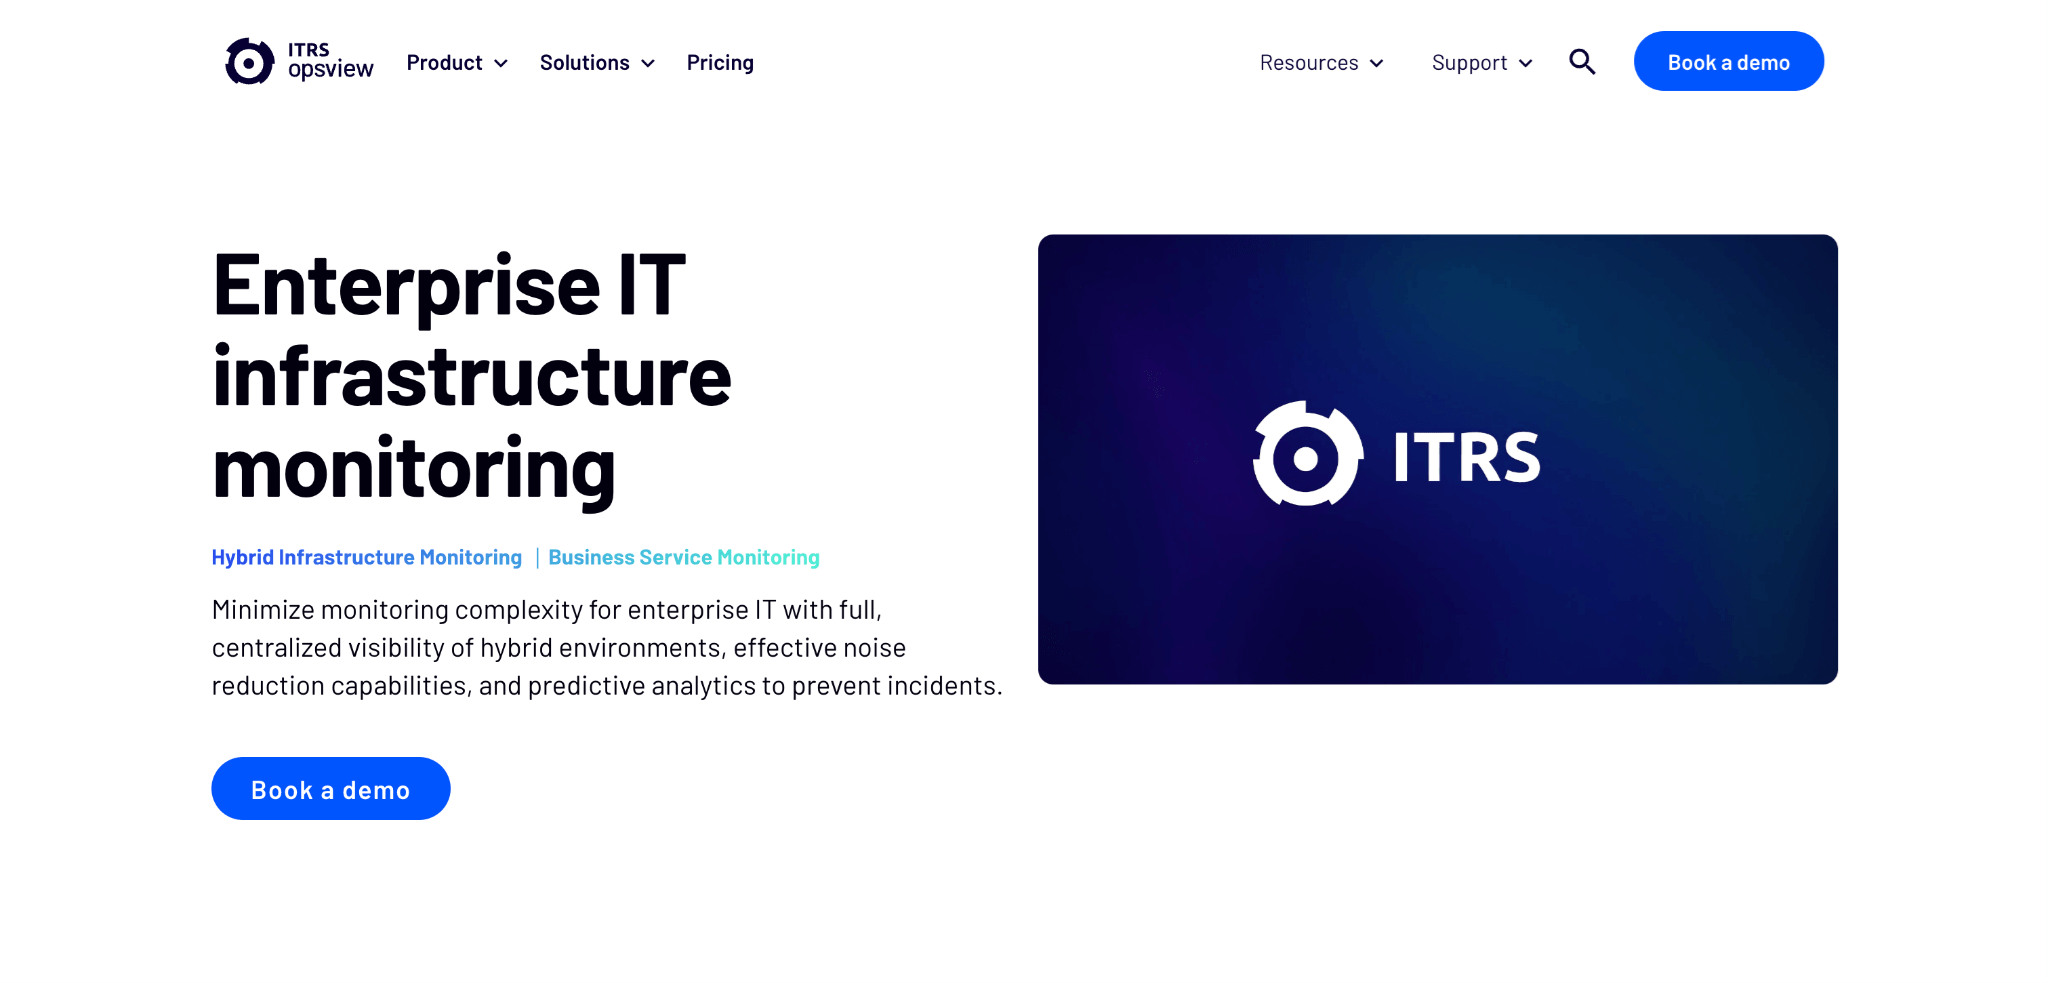
Opsview provides multiple host templates for managing Azure Cloud Resources including VMs, load balancers, and storage accounts. Azure Express Scan offers a configuration wizard for quickly discovering and importing Azure objects.
ScienceLogic
ScienceLogic uses Azure APIs to troubleshoot issues, monitor availability, map dependencies between on-site and Azure Cloud environments, and track workload migrations. The platform manages technology across any environment at scale.
Better Stack
Better Stack is a modern observability platform that works smoothly with Azure, combining logs, metrics, and alerts from Azure IaaS and PaaS resources into clear, intuitive dashboards. Better Stack offers a user-friendly interface with powerful querying capabilities and is designed for teams looking for an accessible yet comprehensive monitoring solution.
Specialized Azure Monitoring
Cerebrata
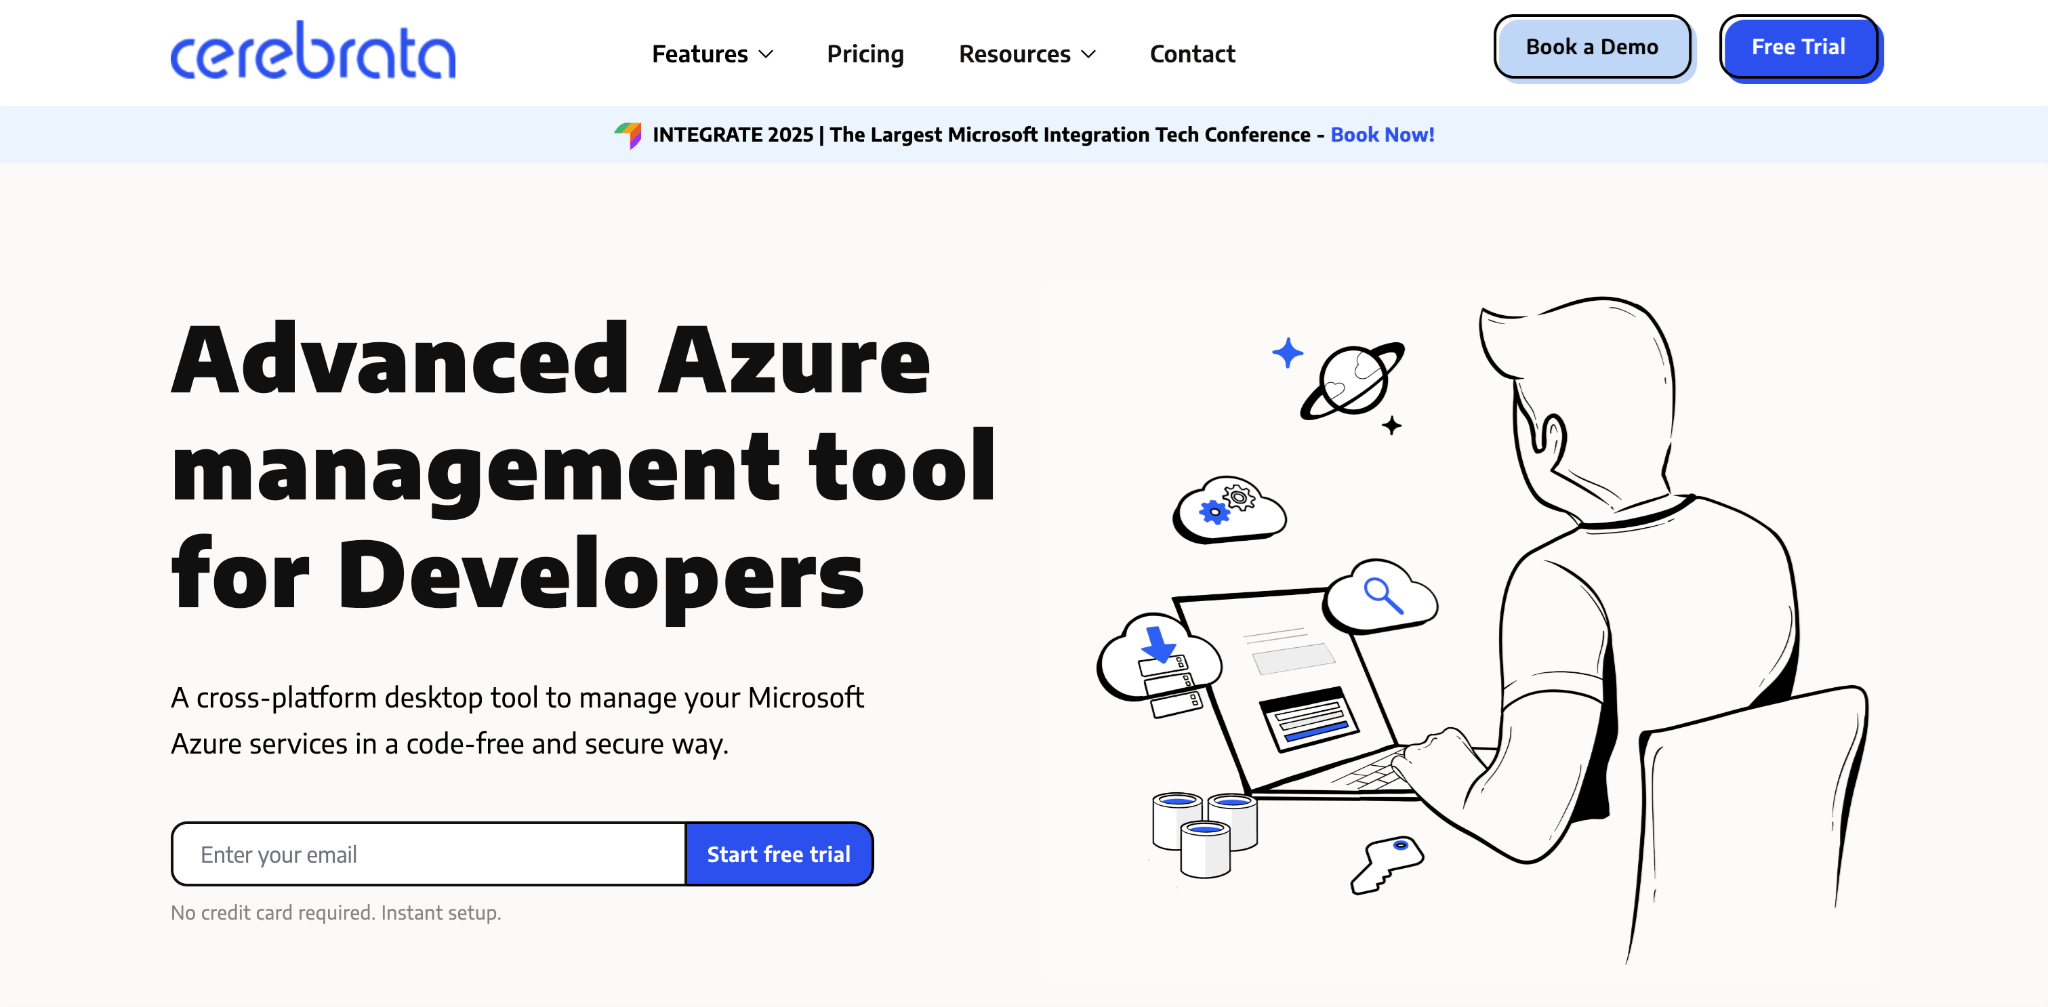
Cerebrata is a developer-focused Azure cloud management tool that works across Linux, Windows, and macOS environments. It integrates multiple Azure explorers in a single interface and enables secure, code-free management of Azure resources.
Nodinite
Nodinite enables bypassing the Azure Web Portal for troubleshooting with auto-healing capabilities that automatically resolve detected issues. It offers role-based, self-service, and audited access with one license covering all Azure Storage containers and Web Jobs.
Open Source & Specialized Platforms
Elastic Stack (ELK)
Elastic Stack is one of the most popular open-source log management platforms consisting of Elasticsearch, Logstash, Kibana, and Beats. The ELK stack excels at collecting, parsing, and visualizing large volumes of Azure log data, making it ideal for organizations wanting full control over their log analytics infrastructure without vendor lock-in.
Prometheus + Grafana
A powerful open-source combination where Prometheus handles metrics collection and storage while Grafana provides visualization and alerting. This stack is particularly popular for Azure Kubernetes Service (AKS) monitoring and is considered the de facto standard for cloud-native monitoring architectures.
Nagios
Nagios is a classic open-source infrastructure monitoring tool that many organizations still rely on for Azure VM and basic infrastructure monitoring. While older than modern alternatives, Nagios offers robust alerting capabilities and an extensive plugin ecosystem.
Zabbix
Zabbix is an open-source platform that tracks metrics from Azure servers, VMs, and network devices in real time. It includes vendor monitoring templates and diagnostic data reading for Azure VMs, with Python script integration for deeper Azure API monitoring.
Logz.io
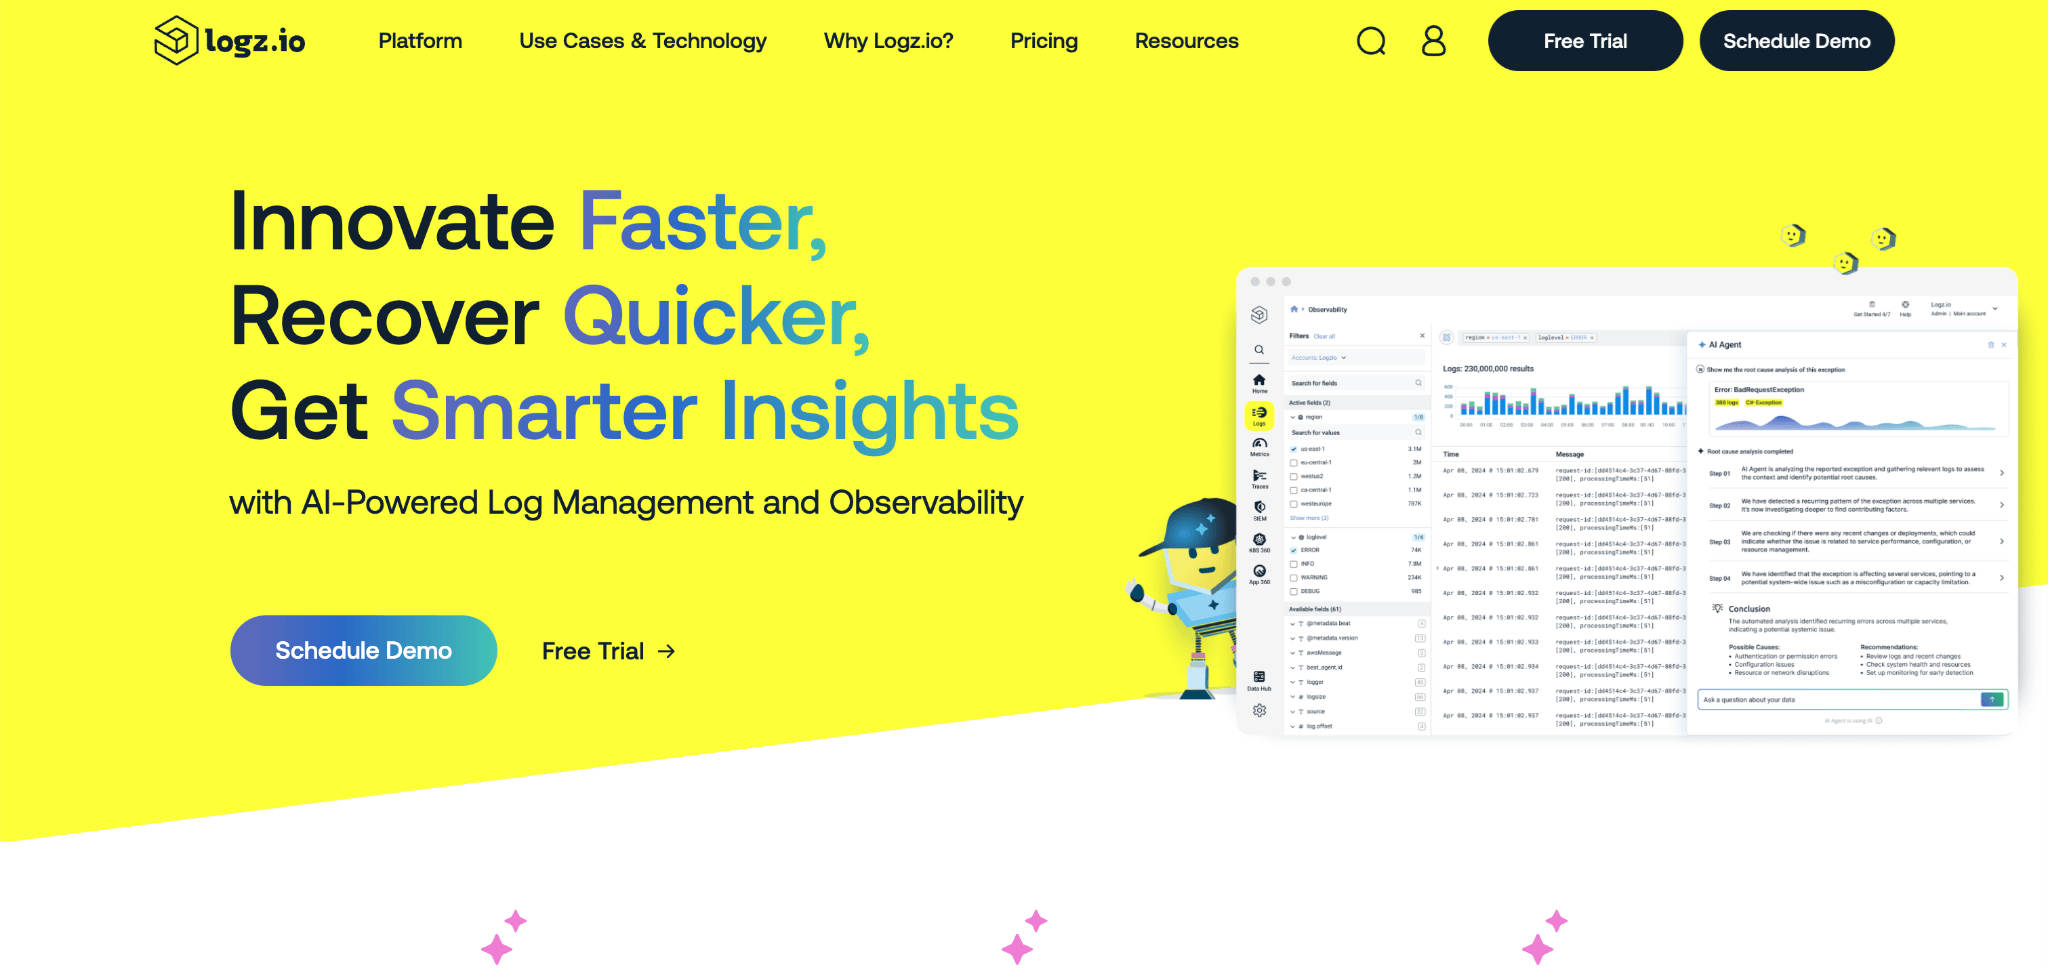
Logz.io is a fully managed offering that enables DevOps teams to observe and set alerts for latency, errors, traffic bottlenecks, and resource saturation. It creates accounts directly from Azure interfaces and configures services to forward logs automatically.
Conclusion: Choosing the Right Azure Monitoring Tool
The right Azure monitoring tool for your organization ultimately depends on your unique requirements and constraints. Don’t rush into a decision. Take the time to thoroughly evaluate each option’s features and benefits.
If you’re running Azure-focused integrations, Azure Monitor and Turbo360 naturally emerge as strong contenders. This makes sense given their Azure-first approach, while other platforms like Datadog, Dynatrace, and New Relic shine when you need broader multi-cloud and application monitoring capabilities.
Azure Monitor offers built-in integration with various Azure services and resources, enabling it to monitor siloed services like Azure Functions, Logic Apps, and API Management.
On the other hand, Turbo360 boasts advanced monitoring and alerting capabilities, customizable dashboards, and detailed reports. It also provides role-based access control, governance, and end-to-end visibility, monitoring, and management of siloed Azure services from an application perspective.
When considering additional tools, factor in your specific requirements:
- For cost optimization: Consider Turbo360 or other cost-focused platforms
- For security and compliance: Evaluate Microsoft Sentinel for native Azure security or Sumo Logic for enterprise compliance needs
- For enterprise environments: Look at Splunk, AppDynamics, BMC TrueSight, or SCOM Managed Instance for traditional enterprise monitoring
- For open-source solutions: Consider the ELK stack for log management, Prometheus + Grafana for metrics and visualization, or Nagios for traditional infrastructure monitoring
- For cloud-native architectures: Prometheus + Grafana is the standard for Kubernetes environments, while Better Stack offers a modern alternative
- For legacy system migration: SCOM Managed Instance provides a pathway for organizations moving from on-premises monitoring
To conclude, Turbo360 turns out to be the top pick for unified monitoring on Azure services and end-to-end tracking across Azure/hybrid integrations that makes root cause analysis and troubleshooting faster.
FAQs
1. What is a good Azure monitoring platform for complete end-to-end visibility?
If you need full visibility across your Azure applications and integrations, Turbo360 is a strong choice. It helps you see how your Azure services connect to each other, tracks message flows, and brings everything into one view. This makes it easier to spot issues quickly and understand what is happening across your entire environment.
2. How is Turbo360 different from Azure Monitor?
Azure Monitor focuses mainly on individual Azure resources. Turbo360 gives you a broader, application-level view. It brings alerts together in one place, shows dependencies between services, and allows you to track end-to-end workflows without needing deep Azure expertise.
3. What is the best Azure monitoring tool for multi-subscription or complex integration environments?
For organizations that run distributed applications or work across several Azure subscriptions, platforms like Turbo360, Datadog and Dynatrace are commonly used. Turbo360 works especially well for Azure-heavy environments because it combines monitoring, cost insights, automation and dependency mapping in one platform.
4. What should I look for when choosing an Azure monitoring tool in 2025?
Focus on features that help you stay ahead of issues. Look for end-to-end tracking, clear dependency mapping, consolidated alerting, cost visibility and support for multi-subscription environments. Turbo360 brings all these capabilities together for teams that rely heavily on Azure services.

