

Put value on top of
your Azure spend.
Move the FinOps conversation from what you spend to the value you get back. Unit Economics puts your own KPIs next to Azure cost so you can talk in margin, not just bill.
Unit Economics
Talk in margin, not just spend.
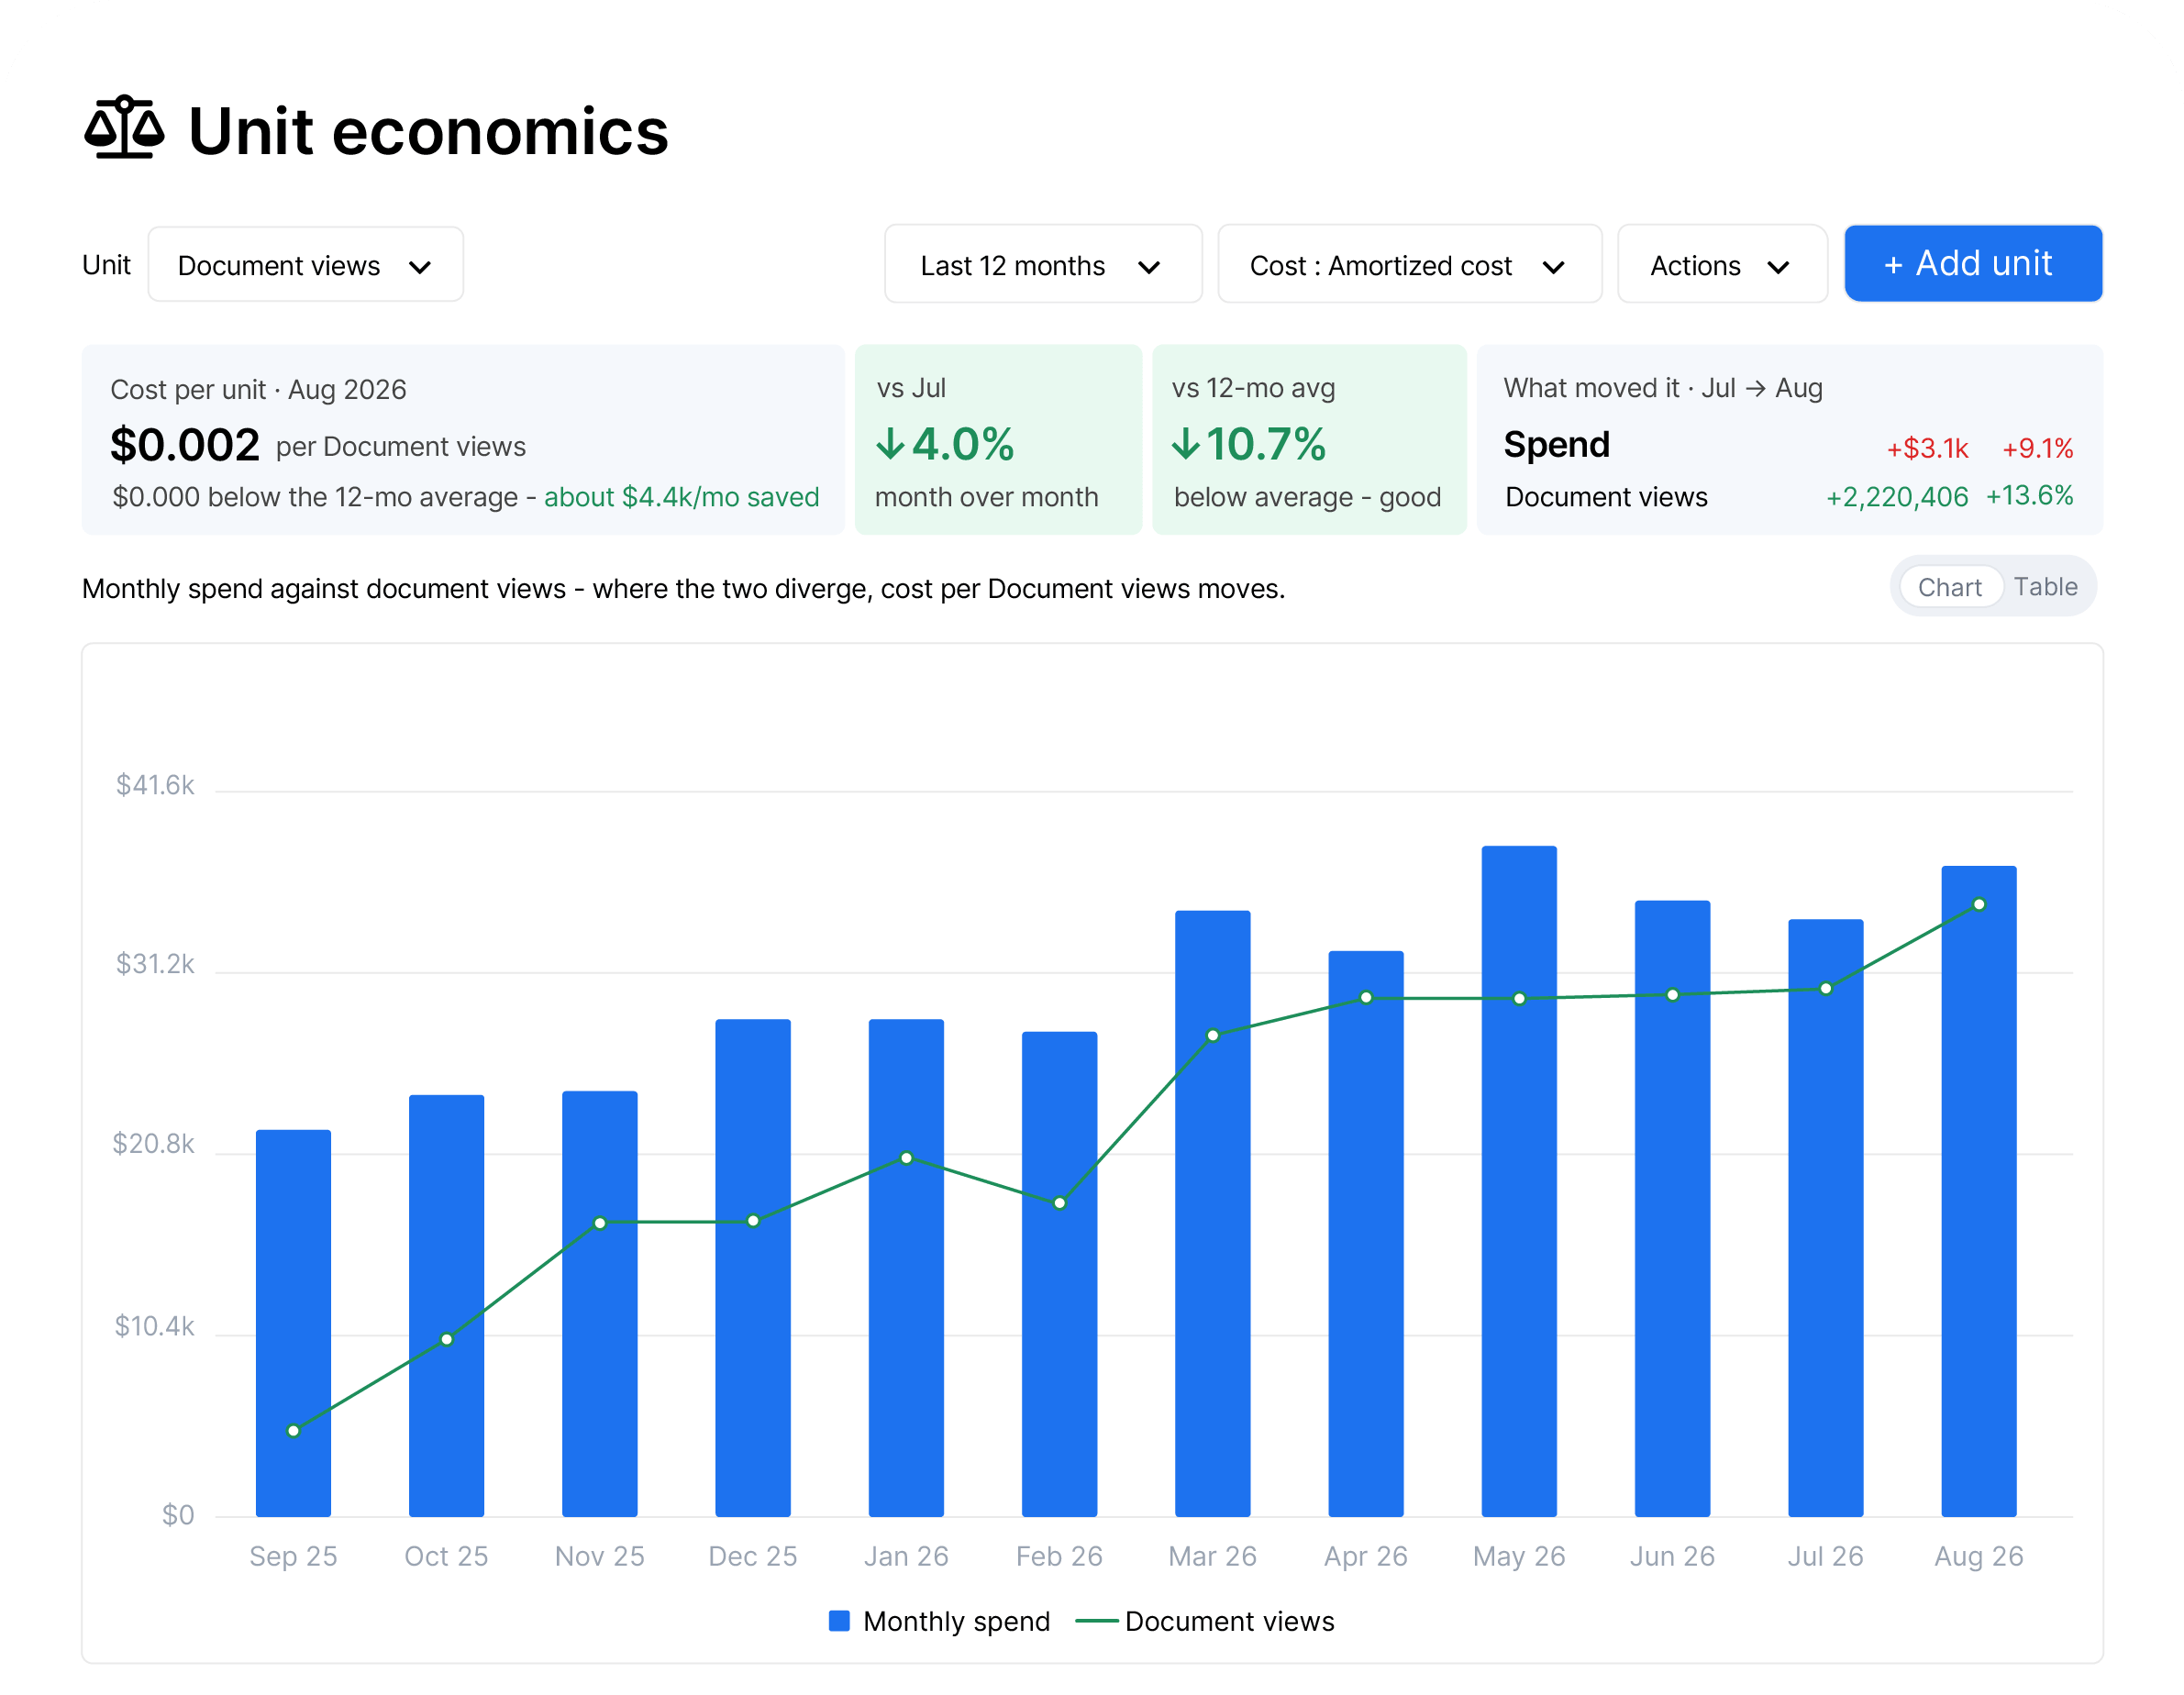
Plot your own KPIs against Azure cost on any node in the tree. Pick the units that matter, orders, active users, MRR or document views, and Turbo360 charts spend against them and shows cost per unit each month.
The conversation shifts from “the bill went up 20%” to “volume grew faster and cost per unit fell”. A status flag shows whether each unit improved or slipped, giving you the numbers to prove FinOps is working.
Reservation Utilization Tracker
See how every reservation is performing, in one view.
Reservation utilisation used to be visible one reservation at a time. The new tracker rolls every reservation in scope into one view, with utilisation over the last month, six months or year, and a waste-drivers breakdown of the underperformers.
FinOps and MSP teams get a top-level read on commitment health, so underused reservations are caught early instead of quietly draining budget.

AI Cost Review
The monthly cost review, written for you in a minute.
The Cost Review Agent turns “how are we doing?” into a full written analysis on demand: current and projected spend, last month, top cost drivers, notable movers, open incidents, optimisation posture and recommended actions.
A review that takes an analyst half an hour now lands in about a minute, and managers can pull it themselves without being FinOps experts.
Scheduler Impact Tracker
Know exactly what your schedules are saving.
The tracker measures each schedule against the baseline you paid before it existed, so savings reflect real avoided cost. Track it per schedule, per resource, or rolled up across all child schedules, with a chart of the cumulative saving.
When leadership asks whether scheduling is worth the effort, you have a defensible number: actual spend versus what you would have paid without the schedule.
Log Analytics savings recommendations
Rightsizing now covers your Log Analytics workspaces.
Rightsizing now evaluates Log Analytics workspaces too. Turbo360 flags idle workspaces with no data coming in and reviews billable data per day to suggest when a commitment tier beats pay-as-you-go.
Log Analytics is an easy place for spend to build up unnoticed. Now it gets the same scrutiny as your compute, with no manual digging.
Feature Enhancements
Resource Inventory
Analysis now ships with a Resource Inventory folder of prebuilt queries. Get an instant view of what you are running by subscription, resource group and resource type.
Redesigned Monitoring tab
Monitoring is reorganised around a new overview, with a health calendar that marks each day green or flags a group budget or anomaly alert, a budget-remaining summary, and your recent incidents at a glance.
Recommendation age tracking
Rightsizing and reservation recommendations now show the date each was first identified and how long it has been open.
Global AI kill switch
A new account-level switch in Settings turns off every AI feature across Turbo360 in one click, for teams whose policies require it. Private-hosted customers can simply leave their Foundry model unconfigured.
SIEM audit-log export
Turbo360 audit logs can now be exported to Log Analytics or an Event Hub on a 30 or 60 minute schedule, ready to forward into Splunk, Sentinel or any SIEM of your choice. A downloadable Bicep template gets the destination set up quickly.
Partner account role replication
Partner accounts get a parent view across every child account, showing total cost usage and cost-import health in one place.
Enterprise-grade security
Have peace of mind that your company's data is fully secure and compliant with the latest industry standard certifications.


