

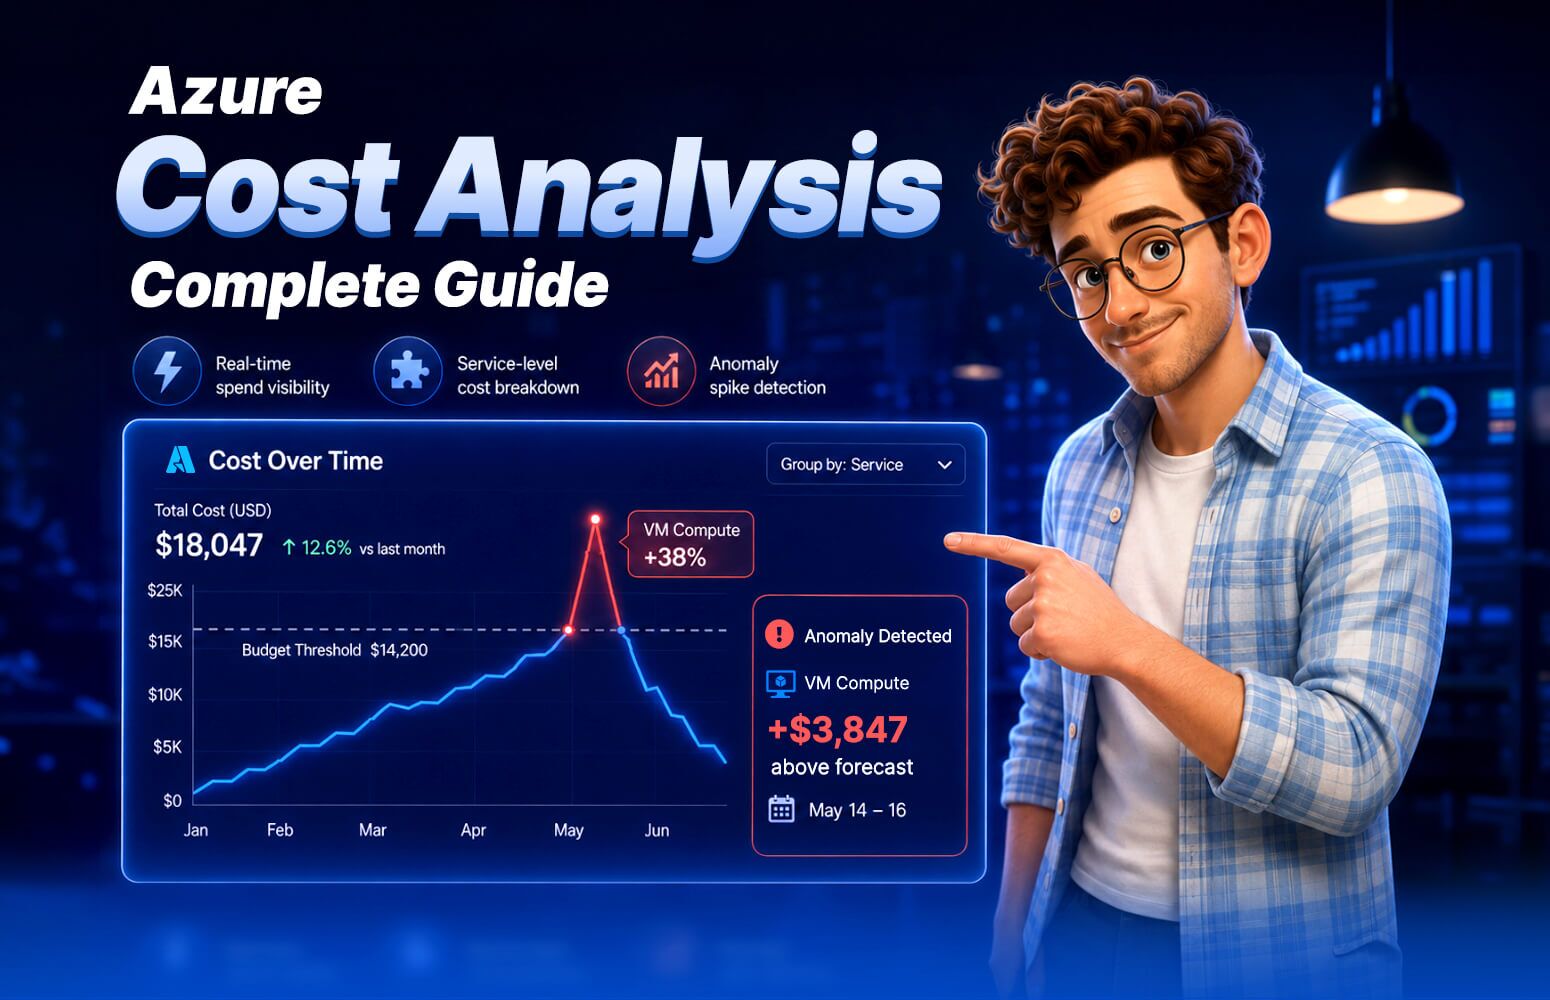
What is Azure Cost Analysis?
Azure Cost Analysis is a built-in reporting tool within Microsoft Cost Management that visualizes and breaks down your Azure spending across dimensions like service, resource group, resource, location, tag, and subscription. It answers the core question “what did I spend, on what, and when,” and it’s available at no extra charge inside the Azure portal.
Cost Analysis is where you go to see your Azure costs. It presents accumulated and daily spend as charts and tables, lets you slice that spend by whatever dimension matters to you, and lets you save the resulting view so you don’t have to rebuild it each month. Microsoft’s own Cost Analysis quickstart is the canonical starting point.

Source: Microsoft
The value is in the dimensions you can group and filter by. These map to the questions teams actually ask:
| Dimension | The question it answers |
| Service (meter category) | Which Azure services cost the most? (VMs, Storage, SQL, networking) |
| Resource group | Which application or environment is driving spend? |
| Resource | Which specific resource is the single biggest line item? |
| Location / region | Where geographically is my spend concentrated? |
| Tag | How much did this team, project, or cost center consume? |
| Subscription | How does spend compare across subscriptions in scope? |
| Reservation | How well are my commitments being used? |
If you can phrase your cost question as “group by X, filter to Y,” Cost Analysis can usually answer it for a single scope. Spanning that same question across many subscriptions or tenants is a different challenge, covered in the companion guide on analyzing Azure costs across multiple subscriptions.
Benefits of Azure Cost Analysis
With Azure Cost Analysis, you can:
- Monitor daily, monthly, and annual spending trends
- Create and manage budgets with automated alerts
- Forecast future expenses based on historical usage patterns
- Generate detailed reports for financial planning and chargeback
Azure Cost Analysis is available directly in the Azure portal under Cost Management + Billing and requires no additional installation, making it an accessible starting point for organizations looking to implement cloud cost governance.
Limitations of Azure Cost Analysis
While Azure Cost Analysis offers ways to save money, it has several limitations that enterprises should be aware of:
Single Subscription View
The most significant limitation is that Azure Cost Analysis only provides detailed analysis at the individual subscription level.
Enterprise organizations with dozens or hundreds of subscriptions must switch between subscriptions for comprehensive cost analysis. Cross-subscription comparison requires manual data extraction and consolidation, creating inefficiencies for large-scale environments.
Data Refresh Delays
Cost data typically has an 8-24 hour delay before appearing in the analysis views. Real-time cost monitoring is not available, creating challenges for time-sensitive decisions.
Usage data for certain services may experience even longer delays. This makes it even more difficult to maintain cost awareness.
Limited Customization
Dashboard customization options are restricted compared to third-party solutions. Advanced filtering scenarios across multiple dimensions can be difficult to implement, and there’s limited ability to create custom metrics that combine different cost factors.
Restricted Historical Data
Standard retention periods may not meet the needs of organizations requiring extended historical analysis. Year-over-year comparison capabilities are constrained by data retention policies, and detailed usage data is available for a shorter period than aggregated cost data. This limitation impacts long-term trend analysis and capacity planning.
Integration Challenges
Azure Cost Analysis offers limited native integration with non-Microsoft tools and platforms. Additional effort is required to incorporate Azure cost data into enterprise financial systems, and API limitations exist when building custom reporting solutions. This creates barriers for organizations with heterogeneous cloud environments or established financial reporting workflows.
These limitations become particularly problematic for large enterprises managing complex multi-subscription environments, where comprehensive visibility across the entire Azure estate is essential for effective cost governance. If native tooling is falling short, it’s worth comparing the dedicated Azure cost management tools built to close these governance gaps.
How to Use Azure Cost Analysis: Common Use Cases & Features
Azure Cost Analysis offers a robust set of features to help organizations gain visibility into their cloud spending patterns. In this section, we will explore practical applications of Azure Cost Analysis. We’ll walk through common use cases and demonstrate how to leverage the platform’s visualization features to answer critical cost management questions.
Visualize Cost Usage by Time Period
Azure Cost Analysis view enables you to visualize your cost usage by applying filters over a specified time period. You can easily determine the maximum cost incurred by any resource group or individual resource for any customized date range.
To identify which resource groups are consuming the most budget in a particular month, simply select the resource group option from the list of preview views when defining your cost analysis view, and specify your desired time interval.

Identify Which Resources Cost the Most
To identify your most expensive resource for a specific month, simply select the “resource” option from the preview views list when creating a cost analysis view. Make sure to specify your desired time interval to focus on the exact month you want to analyze.

Anomaly detection in Cost Analysis helps you anticipate cost fluctuations over time, eliminating unexpected surprises. This helps you discover unusual patterns in your cost usage, giving you advance warning when spending deviates from normal trends.
Organize Costs by Properties
Azure Cost Analysis allows you to segment and visualize spending data using multiple properties that align with your organization’s structure and priorities. You can organize costs by:
Key Properties:
- Resource-based: Resource type, resource group, location
- Billing: Subscription, meter category, billing account
- Business: Tags, cost centers, applications
- Optimization: Reserved instance coverage, pricing tier, SKU
To use this feature, simply access Cost Analysis in the Azure portal, select your preferred time range, and use the “Group by” dropdown to choose your primary dimension. Add filters to refine your view and save custom configurations for repeated use.
Understand Billing and Resource Management Scopes
Billing manages your business relationships and issues customer invoices for goods or services. Through your billing account, you can control all your payments, invoices, and cost tracking in one place.
Azure offers three resource management scopes. Each scope supports access and governance management, which may or may not include cost management.

- Management groups are hierarchical containers used to arrange Azure subscriptions. A management group tree can support up to six levels of depth. The Root level and the subscription level are not included in the limit.
- Subscriptions are the primary storage containers for Azure resources.
- Resource groups are logical collections of connected resources for an Azure solution with a standard lifecycle. An illustration would be resources that are deployed and removed simultaneously.
Use cost alerts to monitor usage and spending
Azure Cost Analysis supports three types of alerts to help you proactively monitor your cloud spending. Azure budget alerts notify you when your spending, whether in terms of usage or cost, reaches or exceeds the limit specified in the alert condition.
Credit alerts inform you when your Azure Prepayment (previously called a financial commitment) has run out, with warnings automatically generated at 90% and 100% of your Azure Prepayment credit balance.
Finally, department spending quota alerts send notifications when your department’s spending exceeds a specific quota threshold, helping you maintain financial control across organizational units.

Azure Cost Management vs Cost Analysis: what’s the difference?
Cost Management is the suite; Cost Analysis is one view inside it. Microsoft Cost Management is the umbrella set of FinOps tools in the Azure portal, and it includes budgets, alerts, exports, recommendations, and reporting. Cost Analysis is specifically the reporting and visualization surface within that suite. People use the two names interchangeably, but Cost Analysis is a component, not a synonym.
This is one of the most common points of confusion, so it’s worth being precise. When someone says “set up a budget” or “export cost data,” they’re using Cost Management features that live alongside Cost Analysis, not inside the Cost Analysis view itself.
A simple way to hold it:
- Microsoft Cost Management is the full toolbox (Cost Analysis plus Budgets, Alerts, Exports, Advisor recommendations, and Cost allocation rules).
- Cost Analysis is the analytics screen you open to explore and report on spend.
The billing plumbing underneath, meaning invoices, payment methods, and billing accounts, sits in Cost Management + Billing, the portal blade that contains all of the above. Microsoft’s Cost Management FAQ is the reference if you want the official scoping of each piece.
Is Azure Cost Analysis free?
Yes, Azure Cost Analysis is free. It’s included with every Azure subscription at no additional cost when analyzing your own Azure usage in the portal. There’s no license or add-on to buy. The one nuance: pulling Azure cost data through the Cost Management exports or API into external systems at high volume can incur a small per-transaction query cost, and third-party cost platforms are priced separately.
For the vast majority of teams, “free” is the honest answer. You pay for Azure, and Cost Analysis comes with it. The cost isn’t the tool. It’s the time teams spend working around its limits at scale, which is a different conversation covered further down.
How to analyze your Azure costs, step by step
To analyze Azure costs: open Cost Management + Billing in the portal, select Cost analysis, set your scope (subscription, resource group, or management group), choose a time range, then use Group by to break spend down by service, resource group, tag, or resource. Apply filters to narrow the view, and save it so it reloads the same way next time.
Each step below is self-contained. Microsoft’s common cost analysis uses doc walks through the same surface with screenshots if you want to follow along in the portal.
- Open Cost Analysis. In the Azure portal, search for Cost Management + Billing, then select Cost analysis from the left menu.
- Set your scope. Use the scope selector at the top to pick the subscription, resource group, or management group you want to analyze. Your access permissions determine which scopes you can see.
- Pick a time range. The default is the current month-to-date. Switch to last month, the last three months, or a custom range to compare periods.
- Choose a view type. Cost Analysis offers smart views (pre-built breakdowns like Resources, Resource groups, and Services) and customizable views where you control grouping and charts. Smart views are the fastest way to get an answer; custom views are what you save and reuse.
- Group by a dimension. This is the core move. Group by Service to see what type of spend dominates, then group by Resource group or Resource to drill into the driver.
- Add filters. Narrow to a single service, region, or tag value to isolate exactly what you’re investigating. Filters stack, so you can build a highly specific view.
- Save and pin. Save the configured view with a descriptive name (for example, “Monthly infrastructure costs by resource group”) and optionally pin it to a dashboard for one-click access later.
Grouping by resource surfaces your most expensive line items for the period you select.
Reading actual vs. amortized vs. forecast cost
There are three cost metrics in the view, and mixing them up leads to wrong conclusions:
- Actual cost shows charges as they’re billed, so a reservation or upfront purchase appears as a lump on the day it hits.
- Amortized cost spreads those upfront purchases (like reservations) evenly across the term, so daily numbers reflect true consumption rather than billing events. Use amortized for allocation and chargeback.
- Forecast projects expected spend for the remainder of the period based on your recent run rate. Extend the time range into future dates and Cost Analysis draws the projection automatically.
Rule of thumb: use actual for reconciling to the invoice, amortized for team-level analysis, and forecast for budget planning.
Saving and sharing a custom view
Once a view is configured the way a stakeholder needs it, save it. Saved views keep grouping, filters, and time range together, so finance and engineering can each open the view built for them without rebuilding it. You can share a saved view’s URL, and you can export the underlying data (CSV or Excel) on demand or on a schedule from the same screen. Microsoft’s get started with reporting doc covers the reporting surface in more depth.
Azure Cost Analysis best practices
The highest-leverage practices: enforce consistent tagging before you try to allocate, save role-specific views instead of rebuilding, set budget alerts at multiple thresholds (not just 100%), analyze on amortized cost for fairness, and pair Cost Analysis with Azure Advisor so every finding has an action attached. Tagging discipline is the one that makes everything else work.
A short, opinionated list, each with the reason it matters:
- Fix tagging first. Allocation, chargeback, and per-team views are only as good as your tags. Inconsistent or missing tags are the number-one reason cost breakdowns don’t add up. Enforce a tagging standard with Azure Policy so it holds at provisioning time, not as cleanup later. If your tags are already inconsistent across subscriptions, which is the usual reality, you either normalize them by hand or lean on a platform that maps untagged and mistagged spend to the right owner automatically, the way Turbo360’s cost allocation does.
- Save views per audience. Finance wants amortized cost by cost center; engineering wants actual cost by resource group. Build each once, save it, and stop rebuilding the same report every month.
- Set layered budget alerts. Alerts at 70%, 85%, and 100% give you a runway to react, not just a post-mortem after you’ve already blown the budget. Route them to both the finance owner and the engineers who can actually change the spend.
- Analyze on amortized cost. For any team-facing or chargeback view, amortized cost avoids the distortion of upfront reservation purchases landing on one team’s month.
- Pair with Azure Advisor. Cost Analysis tells you what you spent; Azure Advisor tells you what to do about it, such as rightsizing, idle resources, and reservation opportunities. Review them together so insight turns into action.
- Standardize naming. Clear, conventional resource names make high-cost line items self-explanatory in a report instead of a mystery you have to chase down.
- Review on a cadence, not on panic. A spike you find at month-end is money already spent. A recurring review catches drift while you can still act, which is the next section.
Layered budget alerts give you time to react before you exceed a limit, not just a notice after.
What cost reports should you review, and how often?
A workable cadence: engineers check daily spend and anomalies daily to weekly, FinOps and platform teams review service-level and team-level trends weekly, and finance and leadership review allocated spend, budget-vs-actual, and forecast monthly. Match the report’s granularity and audience to the frequency: daily reviews are for catching spikes, monthly reviews are for decisions.
| Cadence | Who | What to review | Why |
| Daily | Engineers, DevOps | Daily cost by resource group; anomaly and spike check | Catch a runaway resource or misconfiguration within hours, not at invoice time |
| Weekly | FinOps, platform, IT managers | Spend by service and team vs. prior week; budget burn rate | Spot drift and trends early enough to correct within the month |
| Monthly | Finance, CFO, directors | Allocated cost by business unit; budget vs. actual; forecast; reservation utilization | Reconcile, report, and make commitment and capacity decisions |
The cadence matters more than the exact numbers: reviewing spend on a schedule is what turns cost data into cost control. Ad-hoc, panic-driven reviews always arrive after the money is gone.
The daily row is where native tooling struggles most. Cost Analysis surfaces anomalies, but its data lag and end-of-cycle alerting mean a spike is often visible only after it’s already run for a day or more. This is the gap same-day anomaly detection is built to close: it flags the deviation when it happens rather than when the invoice confirms it.
Do you need more than native Cost Analysis?
You’ve likely outgrown native Cost Analysis when you’re switching between many subscriptions or tenants to see the whole picture, manually stitching exports together in Excel, unable to allocate shared costs cleanly because tags are inconsistent, or waiting on end-of-month data to catch spikes you needed to know about the same day. Native Cost Analysis is excellent for single-scope reporting; those signals are where teams add Power BI, Copilot, or a dedicated Azure cost platform.
Here’s the honest boundary. For a single subscription, or a tidy management-group hierarchy with disciplined tagging, native Cost Analysis is genuinely enough, and free. The friction shows up at scale. These are the signals, and the common ways teams respond:
| Signal you’ve outgrown native | Common response |
| Many subscriptions or multiple tenants, with no single unified view | Export to Power BI, or adopt a platform that ingests every subscription into one view |
| Reports assembled by hand in Excel each month | Scheduled exports feeding a BI model, or an automated platform |
| Can’t allocate shared costs because tags are inconsistent | Tag normalization, done manually or automated by a cost platform |
| Spikes discovered at month-end, not same-day | Same-day anomaly detection beyond native alerting |
| Need conversational, ad-hoc answers on spend | Copilot in Azure for natural-language queries |
Two native-adjacent options are worth knowing before you reach for a third-party platform.
Cost Analysis vs. Power BI. Power BI, via the Cost Management connector, is the right move when you need custom dashboards, want to blend Azure cost with non-Azure data, or need to give executives polished, always-fresh reports. The trade-off is that you own the modeling, the refresh, and the maintenance. Power BI gives you flexibility, not a turnkey FinOps workflow. It’s good for bespoke reporting and overkill if you just need cleaner cross-subscription rollups. If the rollup is the actual goal, an Azure-native platform like Turbo360 gives you the unified multi-subscription view out of the box without you maintaining a data model to get it.
Cost Analysis vs. Copilot in Azure. Copilot in Azure lets you ask cost questions in natural language (“why did my bill go up last month?”) and get a Cost Analysis-backed answer. It’s a faster front door to the same underlying data: excellent for ad-hoc exploration, but it doesn’t add the cross-tenant rollups, automated allocation, or chargeback that native Cost Analysis lacks.
When the signals above are structural rather than occasional, teams move to a dedicated Azure cost platform. Turbo360, for example, is an Azure-native FinOps platform that unifies every subscription into one view, normalizes inconsistent tags before attributing cost, and flags anomalies the same day rather than at month-end, closing the specific gaps native tooling leaves open at scale. It’s one option among several. If you’re weighing tools, the Azure cost management tools comparison lays out the landscape, and you can see how the native view maps to a dedicated one on the Azure cost analysis product page.
For the deeper how-tos behind each signal, see the focused guides on why your Azure bill is higher than expected, analyzing costs across multiple subscriptions, and Azure cost allocation, showback, and chargeback. For the broader discipline this all sits within, the Azure cost management guide is the companion read, grounded in the FinOps Foundation framework.


